Cheyenne vs Immigrants from Dominica Median Female Earnings
COMPARE
Cheyenne
Immigrants from Dominica
Median Female Earnings
Median Female Earnings Comparison
Cheyenne
Immigrants from Dominica
$35,673
MEDIAN FEMALE EARNINGS
0.0/ 100
METRIC RATING
294th/ 347
METRIC RANK
$37,825
MEDIAN FEMALE EARNINGS
2.0/ 100
METRIC RATING
252nd/ 347
METRIC RANK
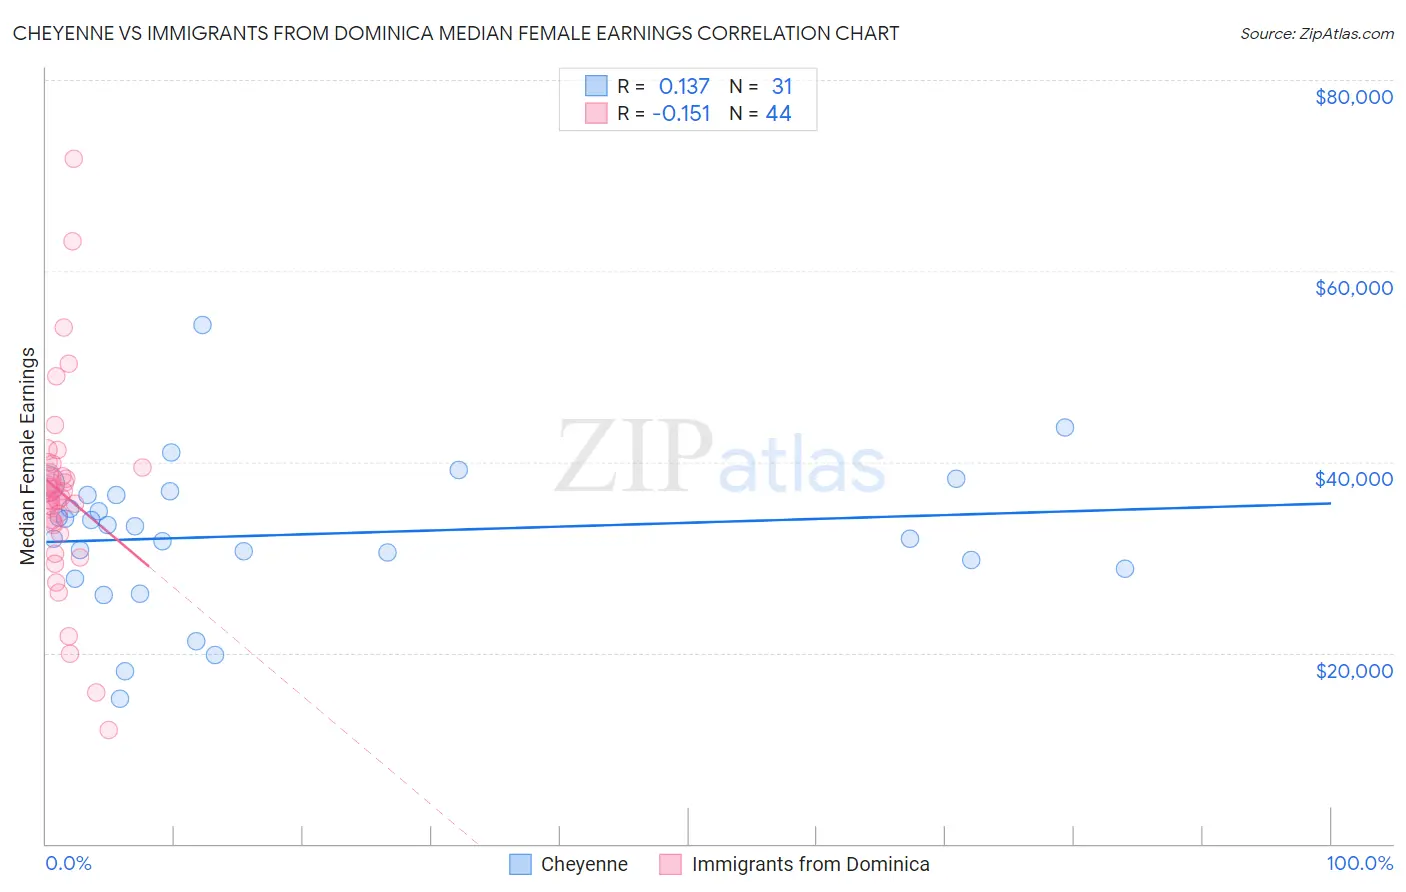
Cheyenne vs Immigrants from Dominica Median Female Earnings Correlation Chart
The statistical analysis conducted on geographies consisting of 80,682,287 people shows a poor positive correlation between the proportion of Cheyenne and median female earnings in the United States with a correlation coefficient (R) of 0.137 and weighted average of $35,673. Similarly, the statistical analysis conducted on geographies consisting of 83,795,110 people shows a poor negative correlation between the proportion of Immigrants from Dominica and median female earnings in the United States with a correlation coefficient (R) of -0.151 and weighted average of $37,825, a difference of 6.0%.
Median Female Earnings Correlation Summary
| Measurement | Cheyenne | Immigrants from Dominica |
| Minimum | $15,218 | $11,953 |
| Maximum | $54,333 | $71,750 |
| Range | $39,115 | $59,797 |
| Mean | $32,359 | $36,730 |
| Median | $33,313 | $36,530 |
| Interquartile 25% (IQ1) | $28,775 | $33,522 |
| Interquartile 75% (IQ3) | $36,563 | $39,104 |
| Interquartile Range (IQR) | $7,788 | $5,583 |
| Standard Deviation (Sample) | $7,704 | $10,397 |
| Standard Deviation (Population) | $7,579 | $10,278 |
Similar Demographics by Median Female Earnings
Demographics Similar to Cheyenne by Median Female Earnings
In terms of median female earnings, the demographic groups most similar to Cheyenne are Comanche ($35,661, a difference of 0.030%), Guatemalan ($35,695, a difference of 0.060%), Mexican American Indian ($35,629, a difference of 0.12%), American ($35,777, a difference of 0.29%), and Hmong ($35,498, a difference of 0.49%).
| Demographics | Rating | Rank | Median Female Earnings |
| Immigrants | Nicaragua | 0.0 /100 | #287 | Tragic $36,023 |
| Immigrants | Zaire | 0.0 /100 | #288 | Tragic $36,017 |
| Bangladeshis | 0.0 /100 | #289 | Tragic $35,960 |
| Central American Indians | 0.0 /100 | #290 | Tragic $35,930 |
| Blackfeet | 0.0 /100 | #291 | Tragic $35,864 |
| Americans | 0.0 /100 | #292 | Tragic $35,777 |
| Guatemalans | 0.0 /100 | #293 | Tragic $35,695 |
| Cheyenne | 0.0 /100 | #294 | Tragic $35,673 |
| Comanche | 0.0 /100 | #295 | Tragic $35,661 |
| Mexican American Indians | 0.0 /100 | #296 | Tragic $35,629 |
| Hmong | 0.0 /100 | #297 | Tragic $35,498 |
| Immigrants | Micronesia | 0.0 /100 | #298 | Tragic $35,477 |
| Immigrants | Guatemala | 0.0 /100 | #299 | Tragic $35,444 |
| Yuman | 0.0 /100 | #300 | Tragic $35,377 |
| Pima | 0.0 /100 | #301 | Tragic $35,326 |
Demographics Similar to Immigrants from Dominica by Median Female Earnings
In terms of median female earnings, the demographic groups most similar to Immigrants from Dominica are Welsh ($37,856, a difference of 0.080%), Immigrants from Iraq ($37,864, a difference of 0.10%), Alaskan Athabascan ($37,905, a difference of 0.21%), Swiss ($37,904, a difference of 0.21%), and Immigrants from Somalia ($37,914, a difference of 0.23%).
| Demographics | Rating | Rank | Median Female Earnings |
| Immigrants | Middle Africa | 2.7 /100 | #245 | Tragic $37,965 |
| Delaware | 2.6 /100 | #246 | Tragic $37,964 |
| Immigrants | Somalia | 2.4 /100 | #247 | Tragic $37,914 |
| Alaskan Athabascans | 2.3 /100 | #248 | Tragic $37,905 |
| Swiss | 2.3 /100 | #249 | Tragic $37,904 |
| Immigrants | Iraq | 2.2 /100 | #250 | Tragic $37,864 |
| Welsh | 2.1 /100 | #251 | Tragic $37,856 |
| Immigrants | Dominica | 2.0 /100 | #252 | Tragic $37,825 |
| Danes | 1.6 /100 | #253 | Tragic $37,730 |
| Whites/Caucasians | 1.1 /100 | #254 | Tragic $37,531 |
| Colville | 1.1 /100 | #255 | Tragic $37,514 |
| Samoans | 1.0 /100 | #256 | Tragic $37,498 |
| Hawaiians | 1.0 /100 | #257 | Tragic $37,497 |
| Belizeans | 0.9 /100 | #258 | Tragic $37,429 |
| Scotch-Irish | 0.8 /100 | #259 | Tragic $37,383 |