Bulgarian vs Immigrants from Belarus Median Female Earnings
COMPARE
Bulgarian
Immigrants from Belarus
Median Female Earnings
Median Female Earnings Comparison
Bulgarians
Immigrants from Belarus
$43,638
MEDIAN FEMALE EARNINGS
100.0/ 100
METRIC RATING
43rd/ 347
METRIC RANK
$44,757
MEDIAN FEMALE EARNINGS
100.0/ 100
METRIC RATING
26th/ 347
METRIC RANK
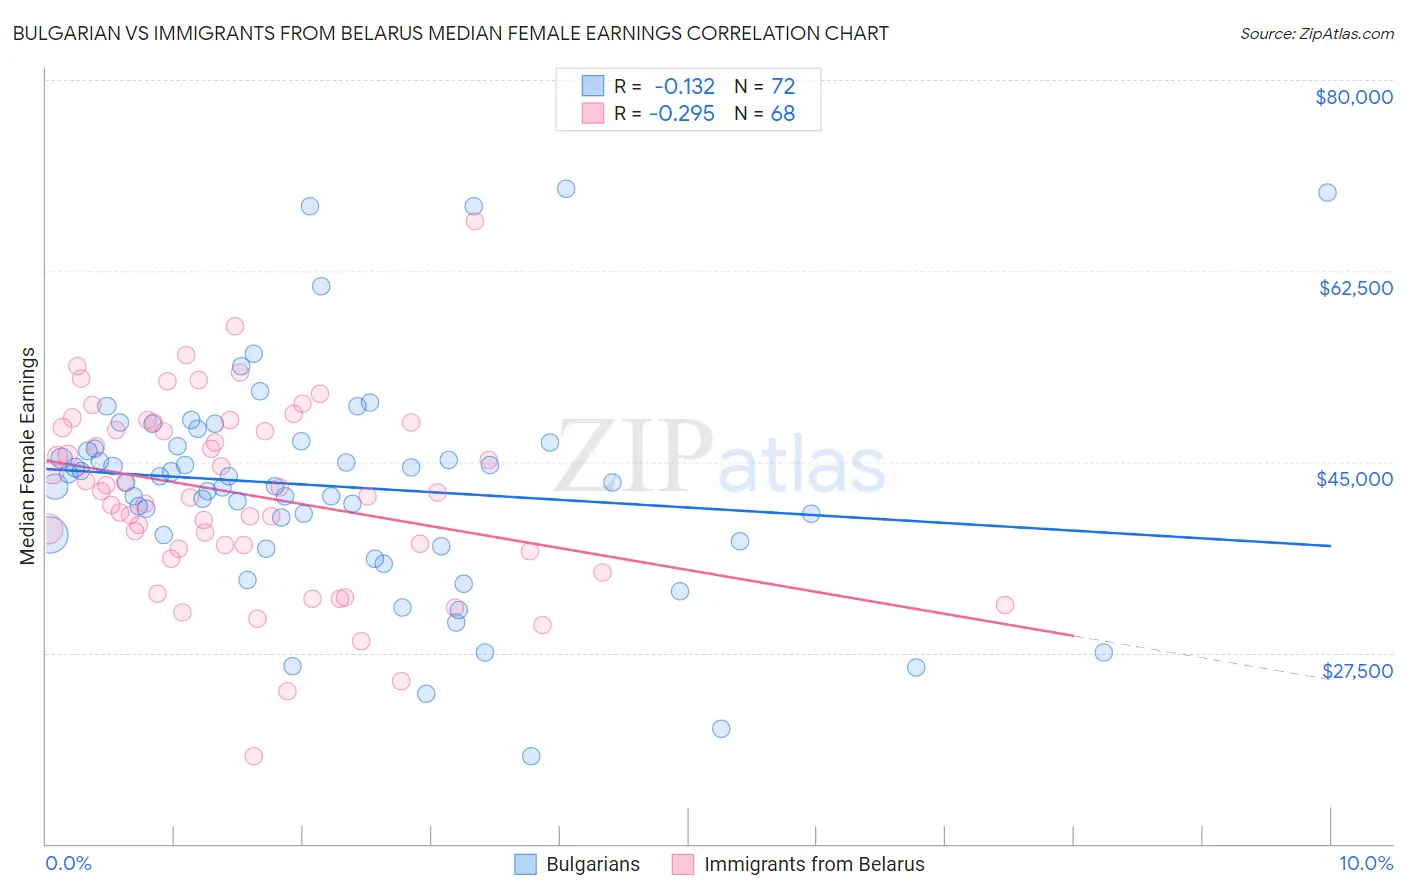
Bulgarian vs Immigrants from Belarus Median Female Earnings Correlation Chart
The statistical analysis conducted on geographies consisting of 205,601,132 people shows a poor negative correlation between the proportion of Bulgarians and median female earnings in the United States with a correlation coefficient (R) of -0.132 and weighted average of $43,638. Similarly, the statistical analysis conducted on geographies consisting of 150,178,879 people shows a weak negative correlation between the proportion of Immigrants from Belarus and median female earnings in the United States with a correlation coefficient (R) of -0.295 and weighted average of $44,757, a difference of 2.6%.
Median Female Earnings Correlation Summary
| Measurement | Bulgarian | Immigrants from Belarus |
| Minimum | $18,066 | $17,969 |
| Maximum | $70,060 | $67,083 |
| Range | $51,994 | $49,114 |
| Mean | $42,770 | $42,072 |
| Median | $43,122 | $42,243 |
| Interquartile 25% (IQ1) | $37,998 | $37,178 |
| Interquartile 75% (IQ3) | $46,606 | $48,362 |
| Interquartile Range (IQR) | $8,608 | $11,183 |
| Standard Deviation (Sample) | $10,148 | $8,617 |
| Standard Deviation (Population) | $10,078 | $8,553 |
Demographics Similar to Bulgarians and Immigrants from Belarus by Median Female Earnings
In terms of median female earnings, the demographic groups most similar to Bulgarians are Bhutanese ($43,648, a difference of 0.020%), Immigrants from Denmark ($43,646, a difference of 0.020%), Immigrants from Czechoslovakia ($43,571, a difference of 0.15%), Immigrants from Malaysia ($43,835, a difference of 0.45%), and Israeli ($43,852, a difference of 0.49%). Similarly, the demographic groups most similar to Immigrants from Belarus are Immigrants from Sweden ($44,774, a difference of 0.040%), Turkish ($44,695, a difference of 0.14%), Immigrants from Russia ($44,680, a difference of 0.17%), Immigrants from Korea ($44,847, a difference of 0.20%), and Immigrants from Belgium ($44,587, a difference of 0.38%).
| Demographics | Rating | Rank | Median Female Earnings |
| Immigrants | Korea | 100.0 /100 | #24 | Exceptional $44,847 |
| Immigrants | Sweden | 100.0 /100 | #25 | Exceptional $44,774 |
| Immigrants | Belarus | 100.0 /100 | #26 | Exceptional $44,757 |
| Turks | 100.0 /100 | #27 | Exceptional $44,695 |
| Immigrants | Russia | 100.0 /100 | #28 | Exceptional $44,680 |
| Immigrants | Belgium | 100.0 /100 | #29 | Exceptional $44,587 |
| Asians | 100.0 /100 | #30 | Exceptional $44,586 |
| Immigrants | France | 100.0 /100 | #31 | Exceptional $44,541 |
| Immigrants | Northern Europe | 100.0 /100 | #32 | Exceptional $44,366 |
| Immigrants | Asia | 100.0 /100 | #33 | Exceptional $44,198 |
| Russians | 100.0 /100 | #34 | Exceptional $44,169 |
| Immigrants | Sri Lanka | 100.0 /100 | #35 | Exceptional $44,161 |
| Immigrants | Turkey | 100.0 /100 | #36 | Exceptional $44,066 |
| Immigrants | Switzerland | 100.0 /100 | #37 | Exceptional $43,996 |
| Latvians | 100.0 /100 | #38 | Exceptional $43,941 |
| Israelis | 100.0 /100 | #39 | Exceptional $43,852 |
| Immigrants | Malaysia | 100.0 /100 | #40 | Exceptional $43,835 |
| Bhutanese | 100.0 /100 | #41 | Exceptional $43,648 |
| Immigrants | Denmark | 100.0 /100 | #42 | Exceptional $43,646 |
| Bulgarians | 100.0 /100 | #43 | Exceptional $43,638 |
| Immigrants | Czechoslovakia | 100.0 /100 | #44 | Exceptional $43,571 |