Bermudan vs Swedish Householder Income Ages 25 - 44 years
COMPARE
Bermudan
Swedish
Householder Income Ages 25 - 44 years
Householder Income Ages 25 - 44 years Comparison
Bermudans
Swedes
$88,231
HOUSEHOLDER INCOME AGES 25 - 44 YEARS
2.9/ 100
METRIC RATING
235th/ 347
METRIC RANK
$99,136
HOUSEHOLDER INCOME AGES 25 - 44 YEARS
92.7/ 100
METRIC RATING
120th/ 347
METRIC RANK
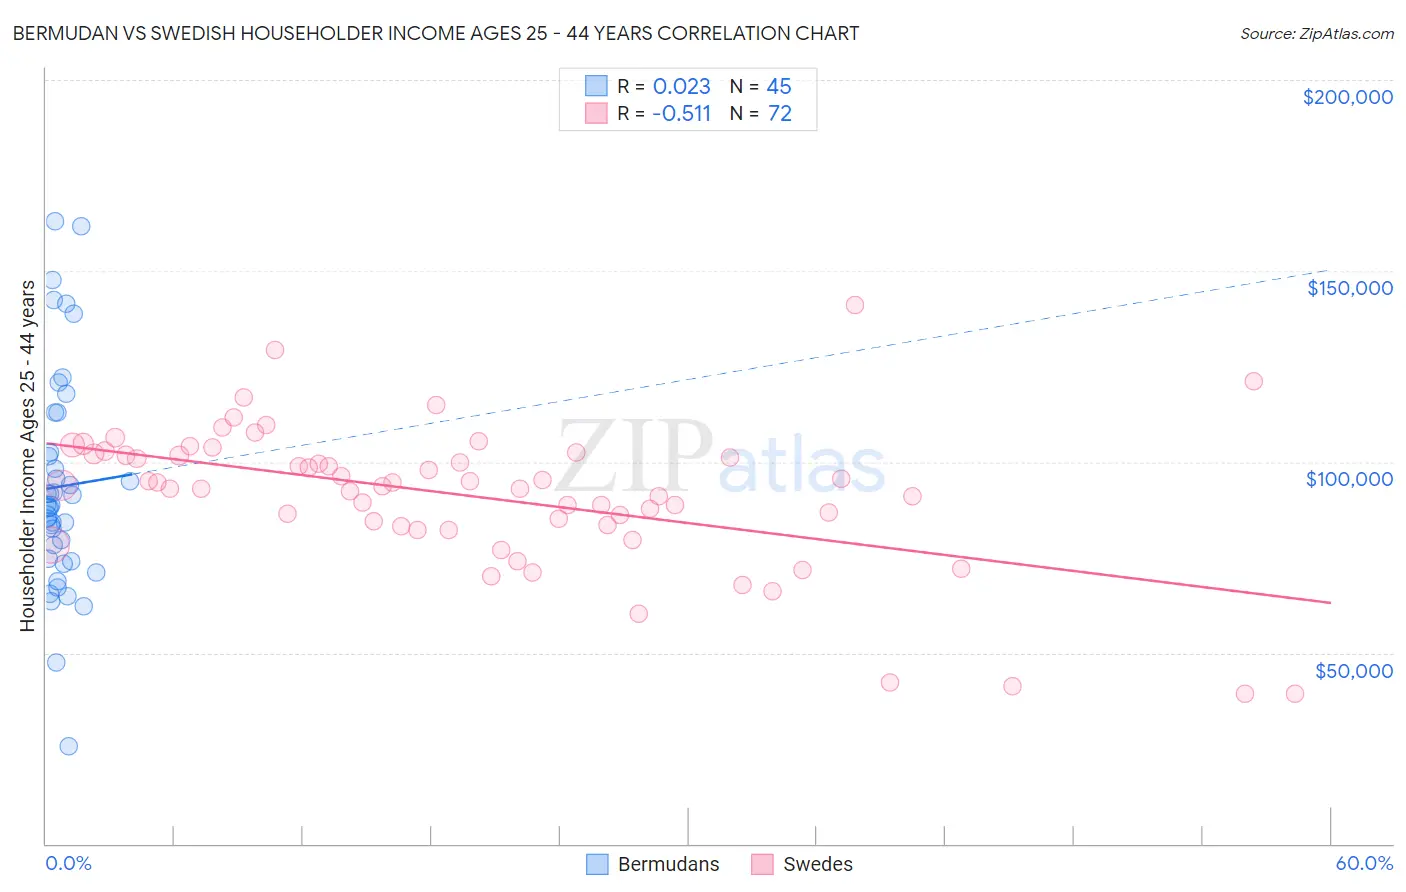
Bermudan vs Swedish Householder Income Ages 25 - 44 years Correlation Chart
The statistical analysis conducted on geographies consisting of 55,699,004 people shows no correlation between the proportion of Bermudans and household income with householder between the ages 25 and 44 in the United States with a correlation coefficient (R) of 0.023 and weighted average of $88,231. Similarly, the statistical analysis conducted on geographies consisting of 535,273,101 people shows a substantial negative correlation between the proportion of Swedes and household income with householder between the ages 25 and 44 in the United States with a correlation coefficient (R) of -0.511 and weighted average of $99,136, a difference of 12.4%.
Householder Income Ages 25 - 44 years Correlation Summary
| Measurement | Bermudan | Swedish |
| Minimum | $25,615 | $39,167 |
| Maximum | $163,159 | $141,131 |
| Range | $137,544 | $101,964 |
| Mean | $93,543 | $91,056 |
| Median | $88,641 | $93,763 |
| Interquartile 25% (IQ1) | $74,251 | $83,282 |
| Interquartile 75% (IQ3) | $107,790 | $101,828 |
| Interquartile Range (IQR) | $33,539 | $18,546 |
| Standard Deviation (Sample) | $28,803 | $18,825 |
| Standard Deviation (Population) | $28,481 | $18,694 |
Similar Demographics by Householder Income Ages 25 - 44 years
Demographics Similar to Bermudans by Householder Income Ages 25 - 44 years
In terms of householder income ages 25 - 44 years, the demographic groups most similar to Bermudans are Venezuelan ($88,232, a difference of 0.0%), Immigrants from Cameroon ($88,214, a difference of 0.020%), Salvadoran ($88,198, a difference of 0.040%), Malaysian ($88,291, a difference of 0.070%), and Nonimmigrants ($88,301, a difference of 0.080%).
| Demographics | Rating | Rank | Householder Income Ages 25 - 44 years |
| Immigrants | Bosnia and Herzegovina | 4.0 /100 | #228 | Tragic $88,819 |
| Immigrants | Barbados | 3.7 /100 | #229 | Tragic $88,687 |
| Alaskan Athabascans | 3.3 /100 | #230 | Tragic $88,446 |
| Immigrants | Grenada | 3.0 /100 | #231 | Tragic $88,311 |
| Immigrants | Nonimmigrants | 3.0 /100 | #232 | Tragic $88,301 |
| Malaysians | 3.0 /100 | #233 | Tragic $88,291 |
| Venezuelans | 2.9 /100 | #234 | Tragic $88,232 |
| Bermudans | 2.9 /100 | #235 | Tragic $88,231 |
| Immigrants | Cameroon | 2.9 /100 | #236 | Tragic $88,214 |
| Salvadorans | 2.8 /100 | #237 | Tragic $88,198 |
| Alaska Natives | 2.6 /100 | #238 | Tragic $88,018 |
| Immigrants | Ghana | 2.2 /100 | #239 | Tragic $87,760 |
| Nicaraguans | 2.2 /100 | #240 | Tragic $87,751 |
| Nigerians | 2.2 /100 | #241 | Tragic $87,730 |
| West Indians | 1.7 /100 | #242 | Tragic $87,205 |
Demographics Similar to Swedes by Householder Income Ages 25 - 44 years
In terms of householder income ages 25 - 44 years, the demographic groups most similar to Swedes are Jordanian ($99,186, a difference of 0.050%), Syrian ($99,215, a difference of 0.080%), Immigrants from Northern Africa ($99,232, a difference of 0.10%), Peruvian ($98,886, a difference of 0.25%), and Portuguese ($99,429, a difference of 0.29%).
| Demographics | Rating | Rank | Householder Income Ages 25 - 44 years |
| Tongans | 94.2 /100 | #113 | Exceptional $99,604 |
| Immigrants | Western Asia | 94.0 /100 | #114 | Exceptional $99,516 |
| Carpatho Rusyns | 93.7 /100 | #115 | Exceptional $99,449 |
| Portuguese | 93.7 /100 | #116 | Exceptional $99,429 |
| Immigrants | Northern Africa | 93.0 /100 | #117 | Exceptional $99,232 |
| Syrians | 92.9 /100 | #118 | Exceptional $99,215 |
| Jordanians | 92.8 /100 | #119 | Exceptional $99,186 |
| Swedes | 92.7 /100 | #120 | Exceptional $99,136 |
| Peruvians | 91.7 /100 | #121 | Exceptional $98,886 |
| Immigrants | Uzbekistan | 91.5 /100 | #122 | Exceptional $98,849 |
| Palestinians | 91.2 /100 | #123 | Exceptional $98,777 |
| Zimbabweans | 90.3 /100 | #124 | Exceptional $98,586 |
| Pakistanis | 89.3 /100 | #125 | Excellent $98,401 |
| British | 89.1 /100 | #126 | Excellent $98,359 |
| Serbians | 88.9 /100 | #127 | Excellent $98,320 |