Bermudan vs Swedish No Schooling Completed
COMPARE
Bermudan
Swedish
No Schooling Completed
No Schooling Completed Comparison
Bermudans
Swedes
2.1%
NO SCHOOLING COMPLETED
30.7/ 100
METRIC RATING
191st/ 347
METRIC RANK
1.4%
NO SCHOOLING COMPLETED
100.0/ 100
METRIC RATING
8th/ 347
METRIC RANK
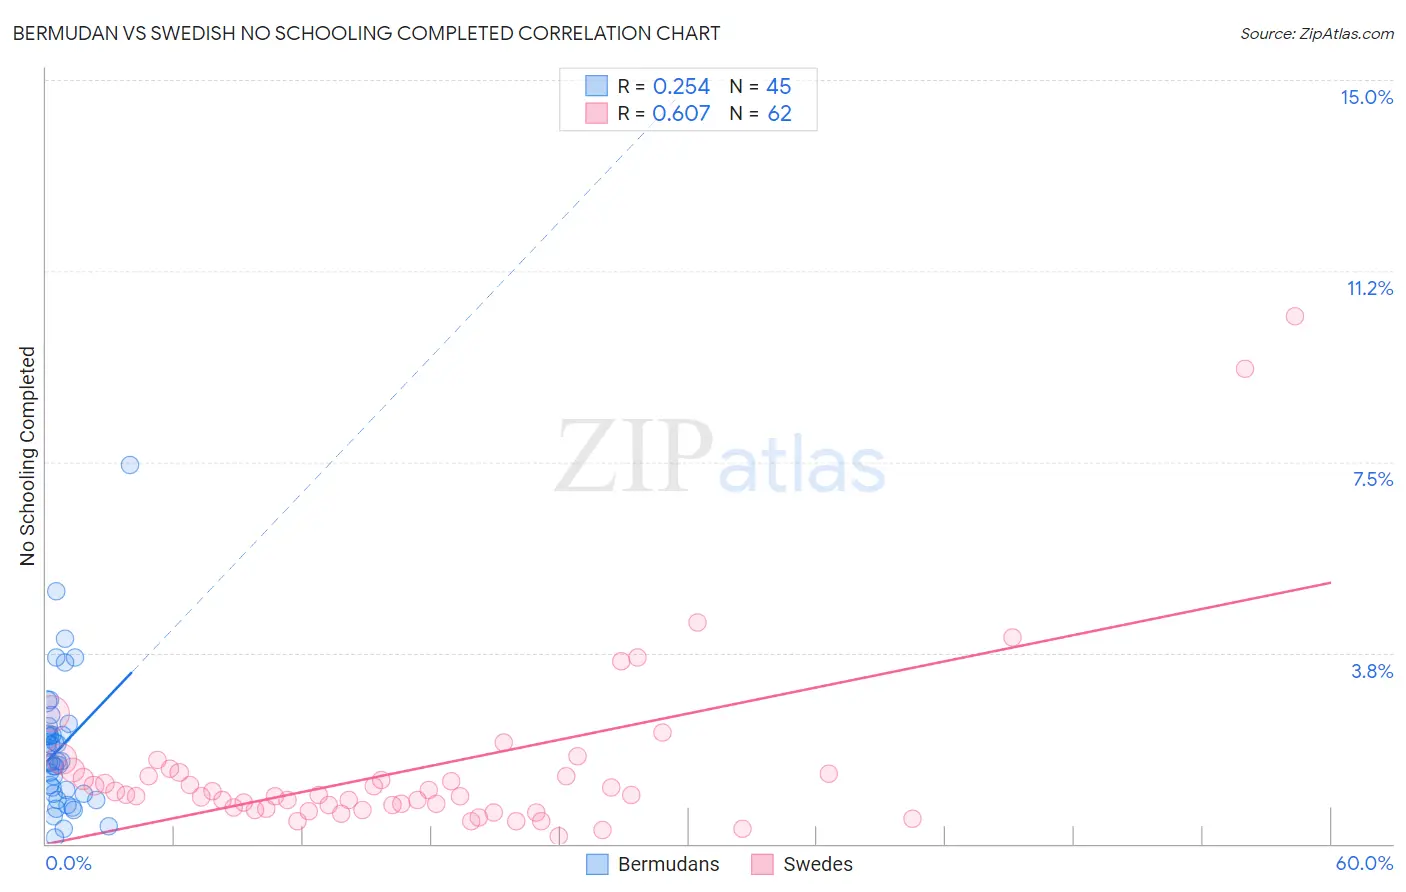
Bermudan vs Swedish No Schooling Completed Correlation Chart
The statistical analysis conducted on geographies consisting of 55,639,195 people shows a weak positive correlation between the proportion of Bermudans and percentage of population with no schooling in the United States with a correlation coefficient (R) of 0.254 and weighted average of 2.1%. Similarly, the statistical analysis conducted on geographies consisting of 523,541,764 people shows a significant positive correlation between the proportion of Swedes and percentage of population with no schooling in the United States with a correlation coefficient (R) of 0.607 and weighted average of 1.4%, a difference of 52.8%.
No Schooling Completed Correlation Summary
| Measurement | Bermudan | Swedish |
| Minimum | 0.12% | 0.14% |
| Maximum | 7.4% | 10.4% |
| Range | 7.3% | 10.2% |
| Mean | 1.9% | 1.5% |
| Median | 1.6% | 0.96% |
| Interquartile 25% (IQ1) | 0.98% | 0.69% |
| Interquartile 75% (IQ3) | 2.2% | 1.4% |
| Interquartile Range (IQR) | 1.2% | 0.68% |
| Standard Deviation (Sample) | 1.3% | 1.8% |
| Standard Deviation (Population) | 1.3% | 1.8% |
Similar Demographics by No Schooling Completed
Demographics Similar to Bermudans by No Schooling Completed
In terms of no schooling completed, the demographic groups most similar to Bermudans are Guamanian/Chamorro (2.2%, a difference of 0.14%), Paraguayan (2.2%, a difference of 0.21%), Spanish American (2.1%, a difference of 0.29%), Immigrants from Albania (2.2%, a difference of 0.38%), and Hawaiian (2.2%, a difference of 0.58%).
| Demographics | Rating | Rank | No Schooling Completed |
| Pima | 41.3 /100 | #184 | Average 2.1% |
| Mongolians | 40.8 /100 | #185 | Average 2.1% |
| Immigrants | Bosnia and Herzegovina | 38.6 /100 | #186 | Fair 2.1% |
| Navajo | 36.5 /100 | #187 | Fair 2.1% |
| Immigrants | Kenya | 36.2 /100 | #188 | Fair 2.1% |
| Immigrants | Egypt | 36.1 /100 | #189 | Fair 2.1% |
| Spanish Americans | 32.6 /100 | #190 | Fair 2.1% |
| Bermudans | 30.7 /100 | #191 | Fair 2.1% |
| Guamanians/Chamorros | 29.8 /100 | #192 | Fair 2.2% |
| Paraguayans | 29.3 /100 | #193 | Fair 2.2% |
| Immigrants | Albania | 28.3 /100 | #194 | Fair 2.2% |
| Hawaiians | 27.0 /100 | #195 | Fair 2.2% |
| Immigrants | Ukraine | 26.1 /100 | #196 | Fair 2.2% |
| Immigrants | Southern Europe | 23.8 /100 | #197 | Fair 2.2% |
| Immigrants | Chile | 22.7 /100 | #198 | Fair 2.2% |
Demographics Similar to Swedes by No Schooling Completed
In terms of no schooling completed, the demographic groups most similar to Swedes are Scottish (1.4%, a difference of 0.53%), Dutch (1.4%, a difference of 1.3%), English (1.4%, a difference of 1.5%), Lithuanian (1.4%, a difference of 2.2%), and Irish (1.4%, a difference of 2.2%).
| Demographics | Rating | Rank | No Schooling Completed |
| Yup'ik | 100.0 /100 | #1 | Exceptional 1.2% |
| Slovaks | 100.0 /100 | #2 | Exceptional 1.3% |
| Norwegians | 100.0 /100 | #3 | Exceptional 1.3% |
| Germans | 100.0 /100 | #4 | Exceptional 1.4% |
| Slovenes | 100.0 /100 | #5 | Exceptional 1.4% |
| Carpatho Rusyns | 100.0 /100 | #6 | Exceptional 1.4% |
| English | 100.0 /100 | #7 | Exceptional 1.4% |
| Swedes | 100.0 /100 | #8 | Exceptional 1.4% |
| Scottish | 100.0 /100 | #9 | Exceptional 1.4% |
| Dutch | 100.0 /100 | #10 | Exceptional 1.4% |
| Lithuanians | 100.0 /100 | #11 | Exceptional 1.4% |
| Irish | 100.0 /100 | #12 | Exceptional 1.4% |
| Poles | 100.0 /100 | #13 | Exceptional 1.4% |
| Scotch-Irish | 100.0 /100 | #14 | Exceptional 1.5% |
| Tlingit-Haida | 100.0 /100 | #15 | Exceptional 1.5% |