Bermudan vs Swedish Disability Age 18 to 34
COMPARE
Bermudan
Swedish
Disability Age 18 to 34
Disability Age 18 to 34 Comparison
Bermudans
Swedes
7.3%
DISABILITY AGE 18 TO 34
0.1/ 100
METRIC RATING
264th/ 347
METRIC RANK
7.5%
DISABILITY AGE 18 TO 34
0.0/ 100
METRIC RATING
285th/ 347
METRIC RANK
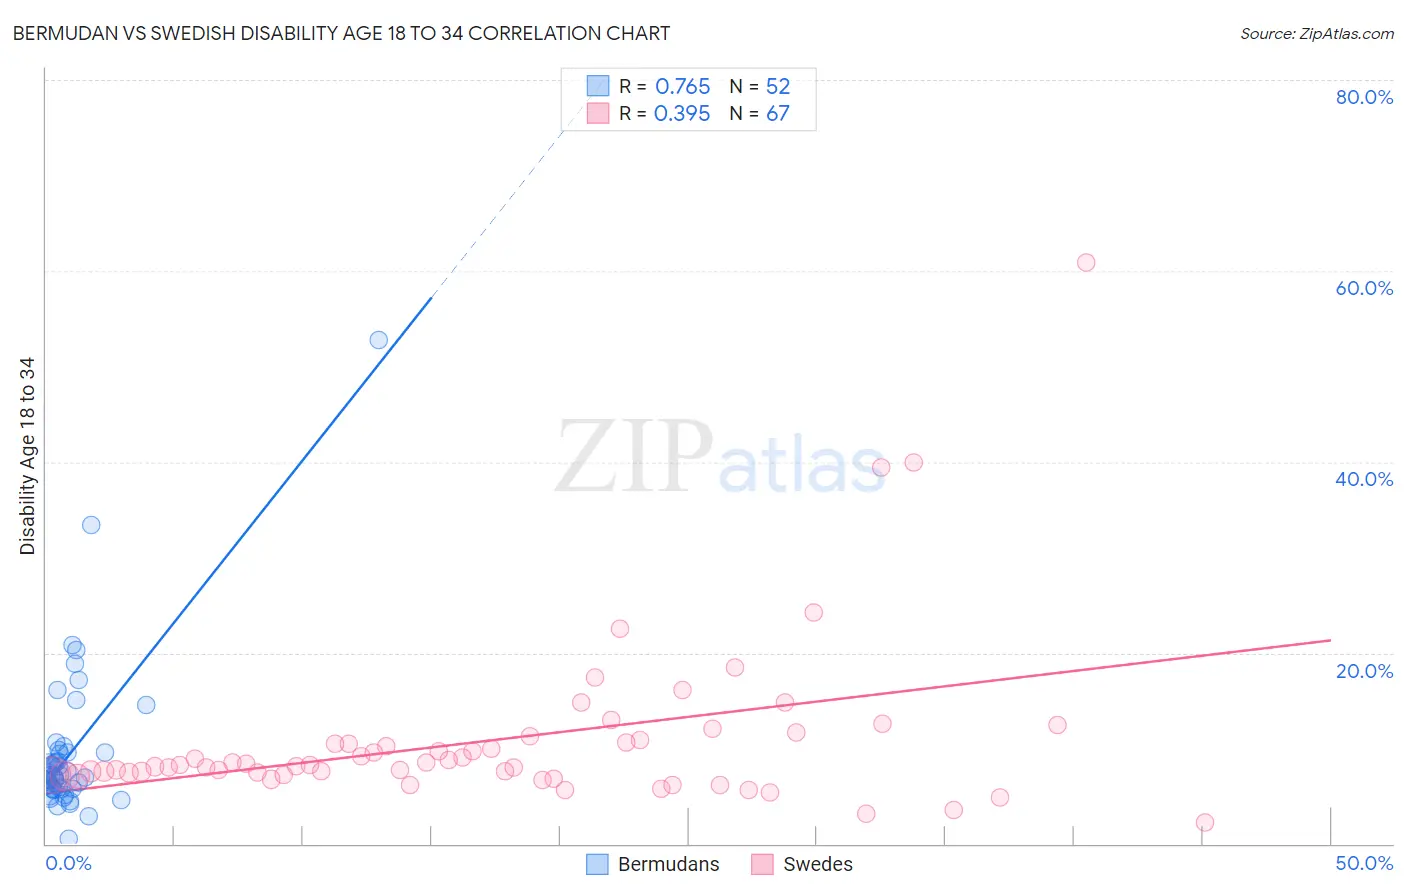
Bermudan vs Swedish Disability Age 18 to 34 Correlation Chart
The statistical analysis conducted on geographies consisting of 55,708,808 people shows a strong positive correlation between the proportion of Bermudans and percentage of population with a disability between the ages 18 and 35 in the United States with a correlation coefficient (R) of 0.765 and weighted average of 7.3%. Similarly, the statistical analysis conducted on geographies consisting of 534,828,262 people shows a mild positive correlation between the proportion of Swedes and percentage of population with a disability between the ages 18 and 35 in the United States with a correlation coefficient (R) of 0.395 and weighted average of 7.5%, a difference of 2.7%.
Disability Age 18 to 34 Correlation Summary
| Measurement | Bermudan | Swedish |
| Minimum | 0.49% | 2.2% |
| Maximum | 52.7% | 60.9% |
| Range | 52.3% | 58.7% |
| Mean | 9.6% | 10.9% |
| Median | 7.1% | 8.2% |
| Interquartile 25% (IQ1) | 5.7% | 7.3% |
| Interquartile 75% (IQ3) | 9.5% | 10.8% |
| Interquartile Range (IQR) | 3.8% | 3.6% |
| Standard Deviation (Sample) | 8.2% | 9.0% |
| Standard Deviation (Population) | 8.1% | 8.9% |
Similar Demographics by Disability Age 18 to 34
Demographics Similar to Bermudans by Disability Age 18 to 34
In terms of disability age 18 to 34, the demographic groups most similar to Bermudans are Slovene (7.3%, a difference of 0.020%), German Russian (7.4%, a difference of 0.19%), British (7.3%, a difference of 0.25%), Bangladeshi (7.4%, a difference of 0.25%), and Portuguese (7.4%, a difference of 0.33%).
| Demographics | Rating | Rank | Disability Age 18 to 34 |
| Czechs | 0.3 /100 | #257 | Tragic 7.2% |
| Immigrants | Micronesia | 0.3 /100 | #258 | Tragic 7.3% |
| Somalis | 0.2 /100 | #259 | Tragic 7.3% |
| Tohono O'odham | 0.2 /100 | #260 | Tragic 7.3% |
| Northern Europeans | 0.2 /100 | #261 | Tragic 7.3% |
| Canadians | 0.2 /100 | #262 | Tragic 7.3% |
| British | 0.2 /100 | #263 | Tragic 7.3% |
| Bermudans | 0.1 /100 | #264 | Tragic 7.3% |
| Slovenes | 0.1 /100 | #265 | Tragic 7.3% |
| German Russians | 0.1 /100 | #266 | Tragic 7.4% |
| Bangladeshis | 0.1 /100 | #267 | Tragic 7.4% |
| Portuguese | 0.1 /100 | #268 | Tragic 7.4% |
| Basques | 0.1 /100 | #269 | Tragic 7.4% |
| Belgians | 0.1 /100 | #270 | Tragic 7.4% |
| Swiss | 0.1 /100 | #271 | Tragic 7.4% |
Demographics Similar to Swedes by Disability Age 18 to 34
In terms of disability age 18 to 34, the demographic groups most similar to Swedes are Hopi (7.5%, a difference of 0.42%), Danish (7.5%, a difference of 0.56%), Spanish (7.5%, a difference of 0.66%), Paiute (7.5%, a difference of 0.86%), and Celtic (7.6%, a difference of 0.90%).
| Demographics | Rating | Rank | Disability Age 18 to 34 |
| Lumbee | 0.1 /100 | #278 | Tragic 7.4% |
| Czechoslovakians | 0.1 /100 | #279 | Tragic 7.4% |
| Yaqui | 0.1 /100 | #280 | Tragic 7.4% |
| Paiute | 0.0 /100 | #281 | Tragic 7.5% |
| Spanish | 0.0 /100 | #282 | Tragic 7.5% |
| Danes | 0.0 /100 | #283 | Tragic 7.5% |
| Hopi | 0.0 /100 | #284 | Tragic 7.5% |
| Swedes | 0.0 /100 | #285 | Tragic 7.5% |
| Celtics | 0.0 /100 | #286 | Tragic 7.6% |
| Norwegians | 0.0 /100 | #287 | Tragic 7.6% |
| Whites/Caucasians | 0.0 /100 | #288 | Tragic 7.6% |
| Immigrants | Nonimmigrants | 0.0 /100 | #289 | Tragic 7.6% |
| Slovaks | 0.0 /100 | #290 | Tragic 7.7% |
| Irish | 0.0 /100 | #291 | Tragic 7.7% |
| Blacks/African Americans | 0.0 /100 | #292 | Tragic 7.7% |