West Indian vs Swedish Householder Income Ages 25 - 44 years
COMPARE
West Indian
Swedish
Householder Income Ages 25 - 44 years
Householder Income Ages 25 - 44 years Comparison
West Indians
Swedes
$87,205
HOUSEHOLDER INCOME AGES 25 - 44 YEARS
1.7/ 100
METRIC RATING
242nd/ 347
METRIC RANK
$99,136
HOUSEHOLDER INCOME AGES 25 - 44 YEARS
92.7/ 100
METRIC RATING
120th/ 347
METRIC RANK
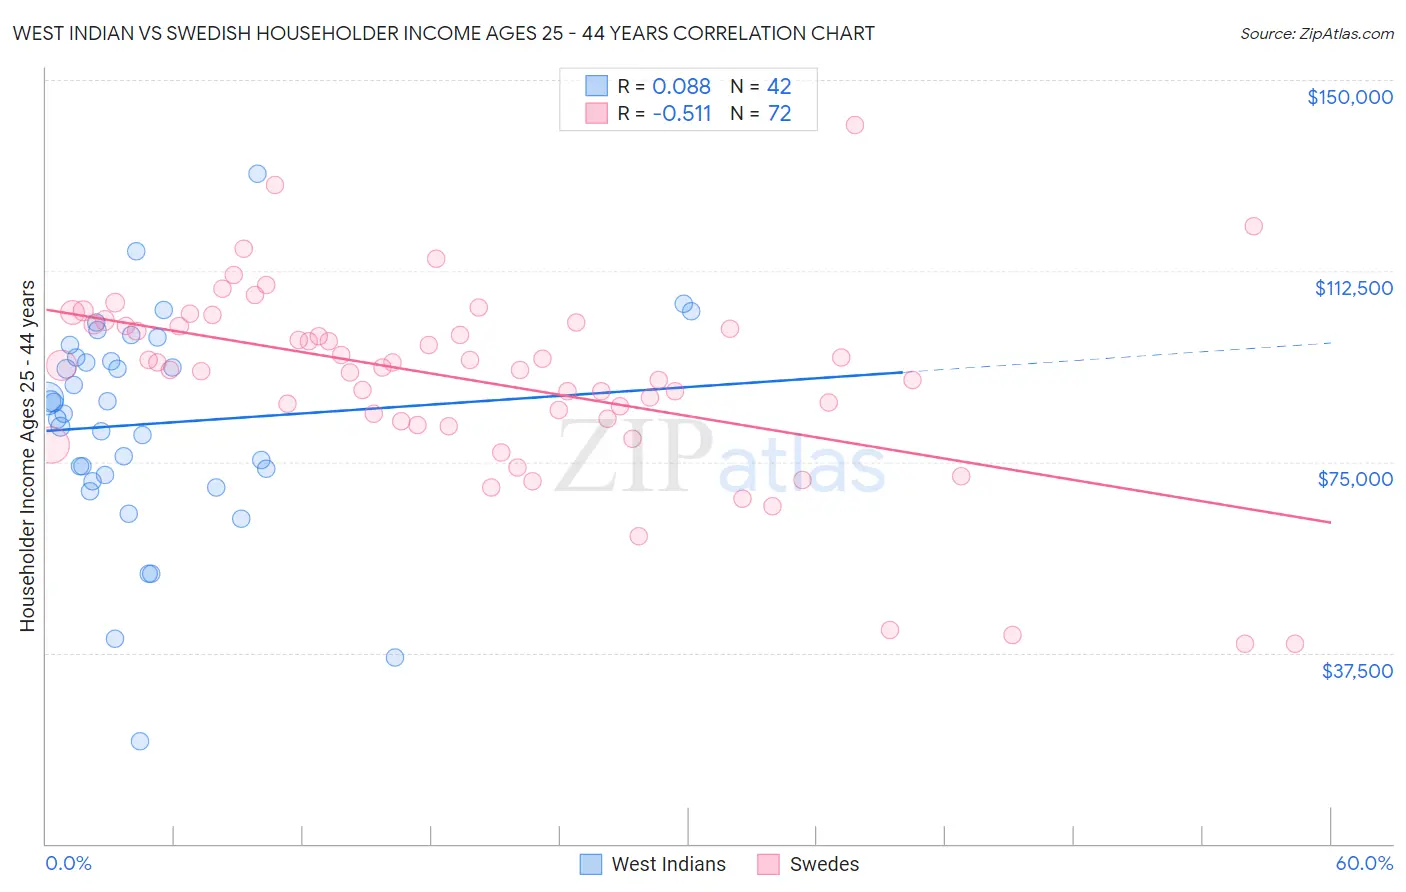
West Indian vs Swedish Householder Income Ages 25 - 44 years Correlation Chart
The statistical analysis conducted on geographies consisting of 253,630,243 people shows a slight positive correlation between the proportion of West Indians and household income with householder between the ages 25 and 44 in the United States with a correlation coefficient (R) of 0.088 and weighted average of $87,205. Similarly, the statistical analysis conducted on geographies consisting of 535,273,101 people shows a substantial negative correlation between the proportion of Swedes and household income with householder between the ages 25 and 44 in the United States with a correlation coefficient (R) of -0.511 and weighted average of $99,136, a difference of 13.7%.
Householder Income Ages 25 - 44 years Correlation Summary
| Measurement | West Indian | Swedish |
| Minimum | $20,234 | $39,167 |
| Maximum | $131,705 | $141,131 |
| Range | $111,471 | $101,964 |
| Mean | $82,528 | $91,056 |
| Median | $85,571 | $93,763 |
| Interquartile 25% (IQ1) | $72,417 | $83,282 |
| Interquartile 75% (IQ3) | $95,404 | $101,828 |
| Interquartile Range (IQR) | $22,987 | $18,546 |
| Standard Deviation (Sample) | $21,318 | $18,825 |
| Standard Deviation (Population) | $21,063 | $18,694 |
Similar Demographics by Householder Income Ages 25 - 44 years
Demographics Similar to West Indians by Householder Income Ages 25 - 44 years
In terms of householder income ages 25 - 44 years, the demographic groups most similar to West Indians are Immigrants from West Indies ($87,063, a difference of 0.16%), Immigrants from Venezuela ($87,038, a difference of 0.19%), Immigrants from El Salvador ($86,913, a difference of 0.34%), Immigrants from Burma/Myanmar ($86,736, a difference of 0.54%), and Nigerian ($87,730, a difference of 0.60%).
| Demographics | Rating | Rank | Householder Income Ages 25 - 44 years |
| Bermudans | 2.9 /100 | #235 | Tragic $88,231 |
| Immigrants | Cameroon | 2.9 /100 | #236 | Tragic $88,214 |
| Salvadorans | 2.8 /100 | #237 | Tragic $88,198 |
| Alaska Natives | 2.6 /100 | #238 | Tragic $88,018 |
| Immigrants | Ghana | 2.2 /100 | #239 | Tragic $87,760 |
| Nicaraguans | 2.2 /100 | #240 | Tragic $87,751 |
| Nigerians | 2.2 /100 | #241 | Tragic $87,730 |
| West Indians | 1.7 /100 | #242 | Tragic $87,205 |
| Immigrants | West Indies | 1.5 /100 | #243 | Tragic $87,063 |
| Immigrants | Venezuela | 1.5 /100 | #244 | Tragic $87,038 |
| Immigrants | El Salvador | 1.4 /100 | #245 | Tragic $86,913 |
| Immigrants | Burma/Myanmar | 1.3 /100 | #246 | Tragic $86,736 |
| Immigrants | Nigeria | 1.2 /100 | #247 | Tragic $86,589 |
| Immigrants | Sudan | 0.9 /100 | #248 | Tragic $86,109 |
| French American Indians | 0.8 /100 | #249 | Tragic $85,899 |
Demographics Similar to Swedes by Householder Income Ages 25 - 44 years
In terms of householder income ages 25 - 44 years, the demographic groups most similar to Swedes are Jordanian ($99,186, a difference of 0.050%), Syrian ($99,215, a difference of 0.080%), Immigrants from Northern Africa ($99,232, a difference of 0.10%), Peruvian ($98,886, a difference of 0.25%), and Portuguese ($99,429, a difference of 0.29%).
| Demographics | Rating | Rank | Householder Income Ages 25 - 44 years |
| Tongans | 94.2 /100 | #113 | Exceptional $99,604 |
| Immigrants | Western Asia | 94.0 /100 | #114 | Exceptional $99,516 |
| Carpatho Rusyns | 93.7 /100 | #115 | Exceptional $99,449 |
| Portuguese | 93.7 /100 | #116 | Exceptional $99,429 |
| Immigrants | Northern Africa | 93.0 /100 | #117 | Exceptional $99,232 |
| Syrians | 92.9 /100 | #118 | Exceptional $99,215 |
| Jordanians | 92.8 /100 | #119 | Exceptional $99,186 |
| Swedes | 92.7 /100 | #120 | Exceptional $99,136 |
| Peruvians | 91.7 /100 | #121 | Exceptional $98,886 |
| Immigrants | Uzbekistan | 91.5 /100 | #122 | Exceptional $98,849 |
| Palestinians | 91.2 /100 | #123 | Exceptional $98,777 |
| Zimbabweans | 90.3 /100 | #124 | Exceptional $98,586 |
| Pakistanis | 89.3 /100 | #125 | Excellent $98,401 |
| British | 89.1 /100 | #126 | Excellent $98,359 |
| Serbians | 88.9 /100 | #127 | Excellent $98,320 |