Barbadian vs Immigrants from Europe Wage/Income Gap
COMPARE
Barbadian
Immigrants from Europe
Wage/Income Gap
Wage/Income Gap Comparison
Barbadians
Immigrants from Europe
19.0%
WAGE/INCOME GAP
100.0/ 100
METRIC RATING
9th/ 347
METRIC RANK
27.1%
WAGE/INCOME GAP
3.8/ 100
METRIC RATING
240th/ 347
METRIC RANK
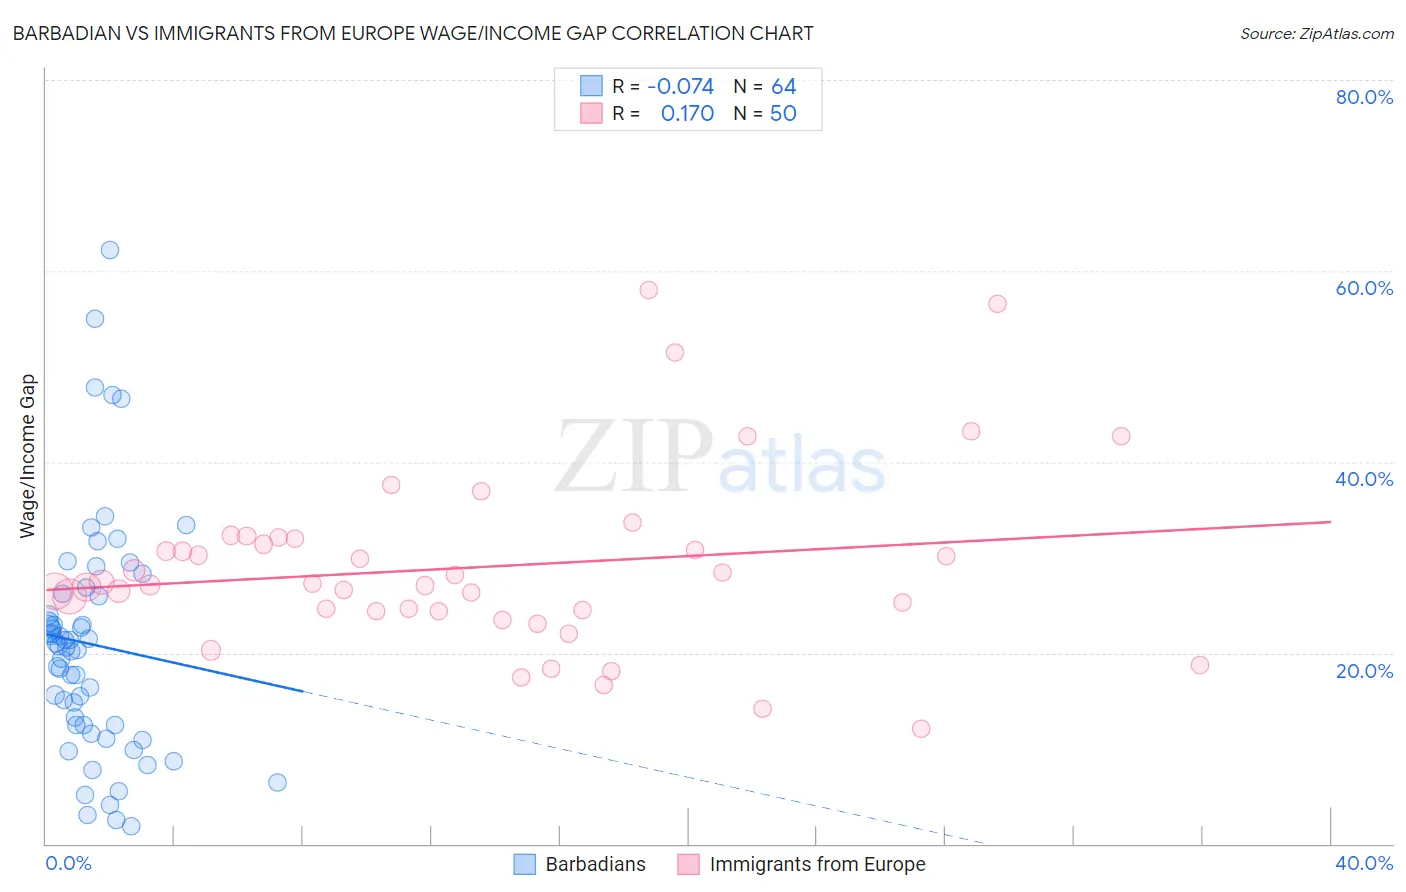
Barbadian vs Immigrants from Europe Wage/Income Gap Correlation Chart
The statistical analysis conducted on geographies consisting of 141,295,930 people shows a slight negative correlation between the proportion of Barbadians and wage/income gap percentage in the United States with a correlation coefficient (R) of -0.074 and weighted average of 19.0%. Similarly, the statistical analysis conducted on geographies consisting of 545,787,785 people shows a poor positive correlation between the proportion of Immigrants from Europe and wage/income gap percentage in the United States with a correlation coefficient (R) of 0.170 and weighted average of 27.1%, a difference of 43.0%.
Wage/Income Gap Correlation Summary
| Measurement | Barbadian | Immigrants from Europe |
| Minimum | 1.8% | 12.1% |
| Maximum | 62.3% | 58.0% |
| Range | 60.4% | 46.0% |
| Mean | 20.9% | 29.0% |
| Median | 20.6% | 27.2% |
| Interquartile 25% (IQ1) | 12.4% | 24.4% |
| Interquartile 75% (IQ3) | 26.1% | 32.0% |
| Interquartile Range (IQR) | 13.7% | 7.6% |
| Standard Deviation (Sample) | 12.3% | 9.5% |
| Standard Deviation (Population) | 12.2% | 9.4% |
Similar Demographics by Wage/Income Gap
Demographics Similar to Barbadians by Wage/Income Gap
In terms of wage/income gap, the demographic groups most similar to Barbadians are Crow (19.1%, a difference of 0.53%), Immigrants from Jamaica (18.8%, a difference of 0.66%), Puerto Rican (18.7%, a difference of 1.3%), Immigrants from Haiti (19.2%, a difference of 1.3%), and Immigrants from West Indies (19.2%, a difference of 1.4%).
| Demographics | Rating | Rank | Wage/Income Gap |
| Immigrants | St. Vincent and the Grenadines | 100.0 /100 | #2 | Exceptional 16.4% |
| Immigrants | Barbados | 100.0 /100 | #3 | Exceptional 17.8% |
| British West Indians | 100.0 /100 | #4 | Exceptional 18.0% |
| Guyanese | 100.0 /100 | #5 | Exceptional 18.3% |
| Immigrants | Guyana | 100.0 /100 | #6 | Exceptional 18.4% |
| Puerto Ricans | 100.0 /100 | #7 | Exceptional 18.7% |
| Immigrants | Jamaica | 100.0 /100 | #8 | Exceptional 18.8% |
| Barbadians | 100.0 /100 | #9 | Exceptional 19.0% |
| Crow | 100.0 /100 | #10 | Exceptional 19.1% |
| Immigrants | Haiti | 100.0 /100 | #11 | Exceptional 19.2% |
| Immigrants | West Indies | 100.0 /100 | #12 | Exceptional 19.2% |
| Trinidadians and Tobagonians | 100.0 /100 | #13 | Exceptional 19.3% |
| Immigrants | Trinidad and Tobago | 100.0 /100 | #14 | Exceptional 19.3% |
| West Indians | 100.0 /100 | #15 | Exceptional 19.6% |
| Jamaicans | 100.0 /100 | #16 | Exceptional 19.6% |
Demographics Similar to Immigrants from Europe by Wage/Income Gap
In terms of wage/income gap, the demographic groups most similar to Immigrants from Europe are Creek (27.1%, a difference of 0.020%), Immigrants from Sri Lanka (27.1%, a difference of 0.070%), Spanish (27.1%, a difference of 0.080%), Chickasaw (27.2%, a difference of 0.15%), and Immigrants from the Azores (27.2%, a difference of 0.16%).
| Demographics | Rating | Rank | Wage/Income Gap |
| Immigrants | Brazil | 5.0 /100 | #233 | Tragic 27.0% |
| Immigrants | Pakistan | 4.9 /100 | #234 | Tragic 27.0% |
| Immigrants | Hungary | 4.8 /100 | #235 | Tragic 27.0% |
| Immigrants | Romania | 4.8 /100 | #236 | Tragic 27.0% |
| Immigrants | Eastern Asia | 4.4 /100 | #237 | Tragic 27.1% |
| Osage | 4.4 /100 | #238 | Tragic 27.1% |
| Estonians | 4.3 /100 | #239 | Tragic 27.1% |
| Immigrants | Europe | 3.8 /100 | #240 | Tragic 27.1% |
| Creek | 3.8 /100 | #241 | Tragic 27.1% |
| Immigrants | Sri Lanka | 3.7 /100 | #242 | Tragic 27.1% |
| Spanish | 3.6 /100 | #243 | Tragic 27.1% |
| Chickasaw | 3.5 /100 | #244 | Tragic 27.2% |
| Immigrants | Azores | 3.5 /100 | #245 | Tragic 27.2% |
| Immigrants | Nonimmigrants | 3.3 /100 | #246 | Tragic 27.2% |
| Celtics | 2.8 /100 | #247 | Tragic 27.3% |