Nigerian vs Immigrants from Europe Wage/Income Gap
COMPARE
Nigerian
Immigrants from Europe
Wage/Income Gap
Wage/Income Gap Comparison
Nigerians
Immigrants from Europe
23.0%
WAGE/INCOME GAP
99.9/ 100
METRIC RATING
78th/ 347
METRIC RANK
27.1%
WAGE/INCOME GAP
3.8/ 100
METRIC RATING
240th/ 347
METRIC RANK
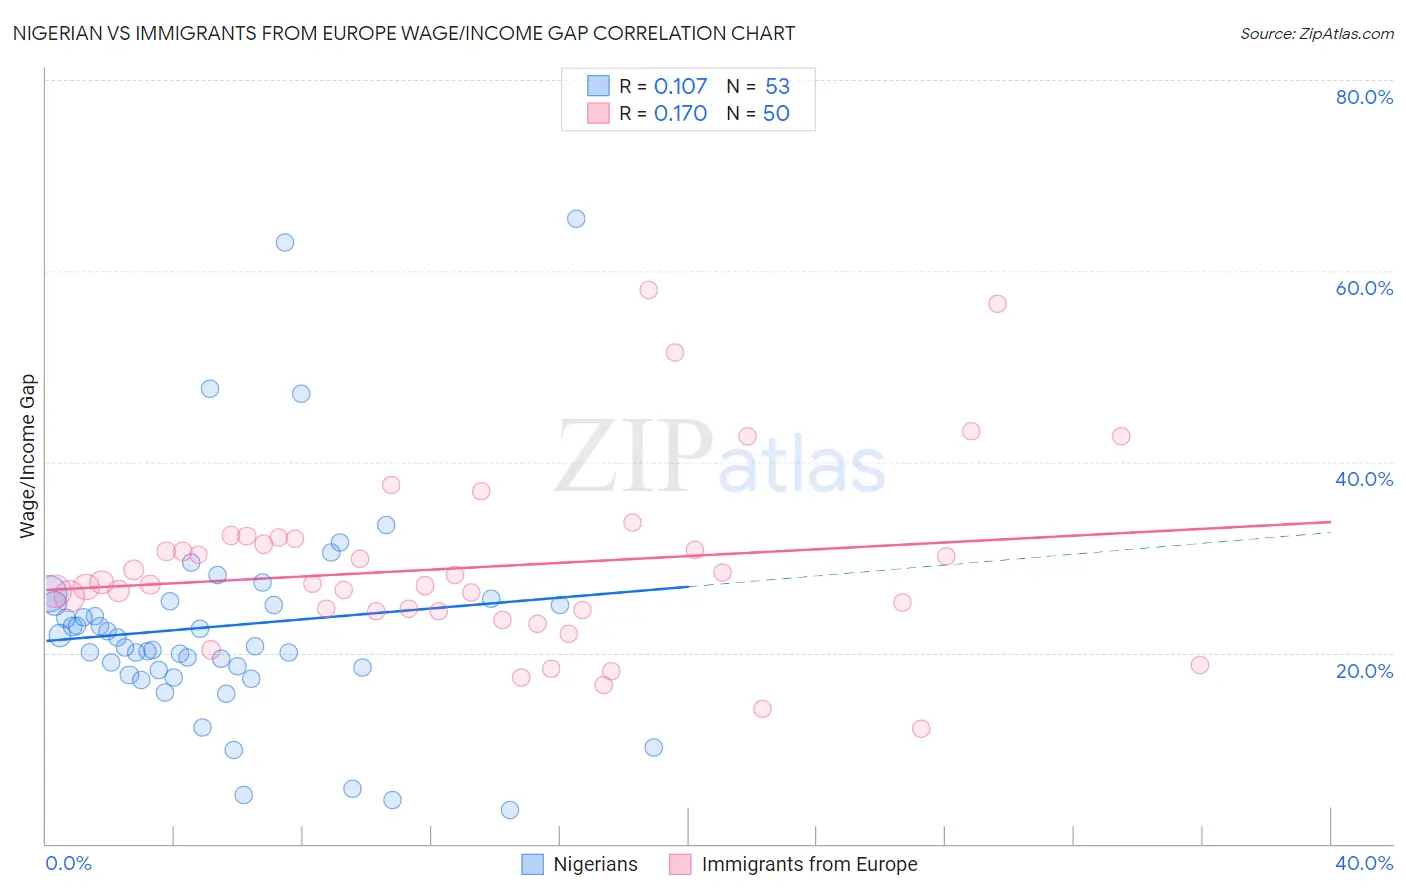
Nigerian vs Immigrants from Europe Wage/Income Gap Correlation Chart
The statistical analysis conducted on geographies consisting of 332,662,722 people shows a poor positive correlation between the proportion of Nigerians and wage/income gap percentage in the United States with a correlation coefficient (R) of 0.107 and weighted average of 23.0%. Similarly, the statistical analysis conducted on geographies consisting of 545,787,785 people shows a poor positive correlation between the proportion of Immigrants from Europe and wage/income gap percentage in the United States with a correlation coefficient (R) of 0.170 and weighted average of 27.1%, a difference of 18.1%.
Wage/Income Gap Correlation Summary
| Measurement | Nigerian | Immigrants from Europe |
| Minimum | 3.6% | 12.1% |
| Maximum | 65.4% | 58.0% |
| Range | 61.9% | 46.0% |
| Mean | 22.8% | 29.0% |
| Median | 20.7% | 27.2% |
| Interquartile 25% (IQ1) | 17.9% | 24.4% |
| Interquartile 75% (IQ3) | 25.3% | 32.0% |
| Interquartile Range (IQR) | 7.3% | 7.6% |
| Standard Deviation (Sample) | 11.7% | 9.5% |
| Standard Deviation (Population) | 11.6% | 9.4% |
Similar Demographics by Wage/Income Gap
Demographics Similar to Nigerians by Wage/Income Gap
In terms of wage/income gap, the demographic groups most similar to Nigerians are Immigrants from Nicaragua (23.0%, a difference of 0.090%), African (22.9%, a difference of 0.11%), Salvadoran (23.0%, a difference of 0.15%), Ecuadorian (22.9%, a difference of 0.24%), and Fijian (22.9%, a difference of 0.25%).
| Demographics | Rating | Rank | Wage/Income Gap |
| Immigrants | El Salvador | 99.9 /100 | #71 | Exceptional 22.8% |
| Sub-Saharan Africans | 99.9 /100 | #72 | Exceptional 22.8% |
| Immigrants | Eastern Africa | 99.9 /100 | #73 | Exceptional 22.8% |
| Immigrants | Burma/Myanmar | 99.9 /100 | #74 | Exceptional 22.8% |
| Fijians | 99.9 /100 | #75 | Exceptional 22.9% |
| Ecuadorians | 99.9 /100 | #76 | Exceptional 22.9% |
| Africans | 99.9 /100 | #77 | Exceptional 22.9% |
| Nigerians | 99.9 /100 | #78 | Exceptional 23.0% |
| Immigrants | Nicaragua | 99.9 /100 | #79 | Exceptional 23.0% |
| Salvadorans | 99.9 /100 | #80 | Exceptional 23.0% |
| Bermudans | 99.8 /100 | #81 | Exceptional 23.1% |
| Central Americans | 99.8 /100 | #82 | Exceptional 23.1% |
| Immigrants | Africa | 99.8 /100 | #83 | Exceptional 23.2% |
| Cubans | 99.7 /100 | #84 | Exceptional 23.3% |
| Immigrants | Cambodia | 99.7 /100 | #85 | Exceptional 23.3% |
Demographics Similar to Immigrants from Europe by Wage/Income Gap
In terms of wage/income gap, the demographic groups most similar to Immigrants from Europe are Creek (27.1%, a difference of 0.020%), Immigrants from Sri Lanka (27.1%, a difference of 0.070%), Spanish (27.1%, a difference of 0.080%), Chickasaw (27.2%, a difference of 0.15%), and Immigrants from the Azores (27.2%, a difference of 0.16%).
| Demographics | Rating | Rank | Wage/Income Gap |
| Immigrants | Brazil | 5.0 /100 | #233 | Tragic 27.0% |
| Immigrants | Pakistan | 4.9 /100 | #234 | Tragic 27.0% |
| Immigrants | Hungary | 4.8 /100 | #235 | Tragic 27.0% |
| Immigrants | Romania | 4.8 /100 | #236 | Tragic 27.0% |
| Immigrants | Eastern Asia | 4.4 /100 | #237 | Tragic 27.1% |
| Osage | 4.4 /100 | #238 | Tragic 27.1% |
| Estonians | 4.3 /100 | #239 | Tragic 27.1% |
| Immigrants | Europe | 3.8 /100 | #240 | Tragic 27.1% |
| Creek | 3.8 /100 | #241 | Tragic 27.1% |
| Immigrants | Sri Lanka | 3.7 /100 | #242 | Tragic 27.1% |
| Spanish | 3.6 /100 | #243 | Tragic 27.1% |
| Chickasaw | 3.5 /100 | #244 | Tragic 27.2% |
| Immigrants | Azores | 3.5 /100 | #245 | Tragic 27.2% |
| Immigrants | Nonimmigrants | 3.3 /100 | #246 | Tragic 27.2% |
| Celtics | 2.8 /100 | #247 | Tragic 27.3% |