Barbadian vs Immigrants from Dominica Median Family Income
COMPARE
Barbadian
Immigrants from Dominica
Median Family Income
Median Family Income Comparison
Barbadians
Immigrants from Dominica
$93,919
MEDIAN FAMILY INCOME
1.1/ 100
METRIC RATING
242nd/ 347
METRIC RANK
$85,411
MEDIAN FAMILY INCOME
0.0/ 100
METRIC RATING
306th/ 347
METRIC RANK
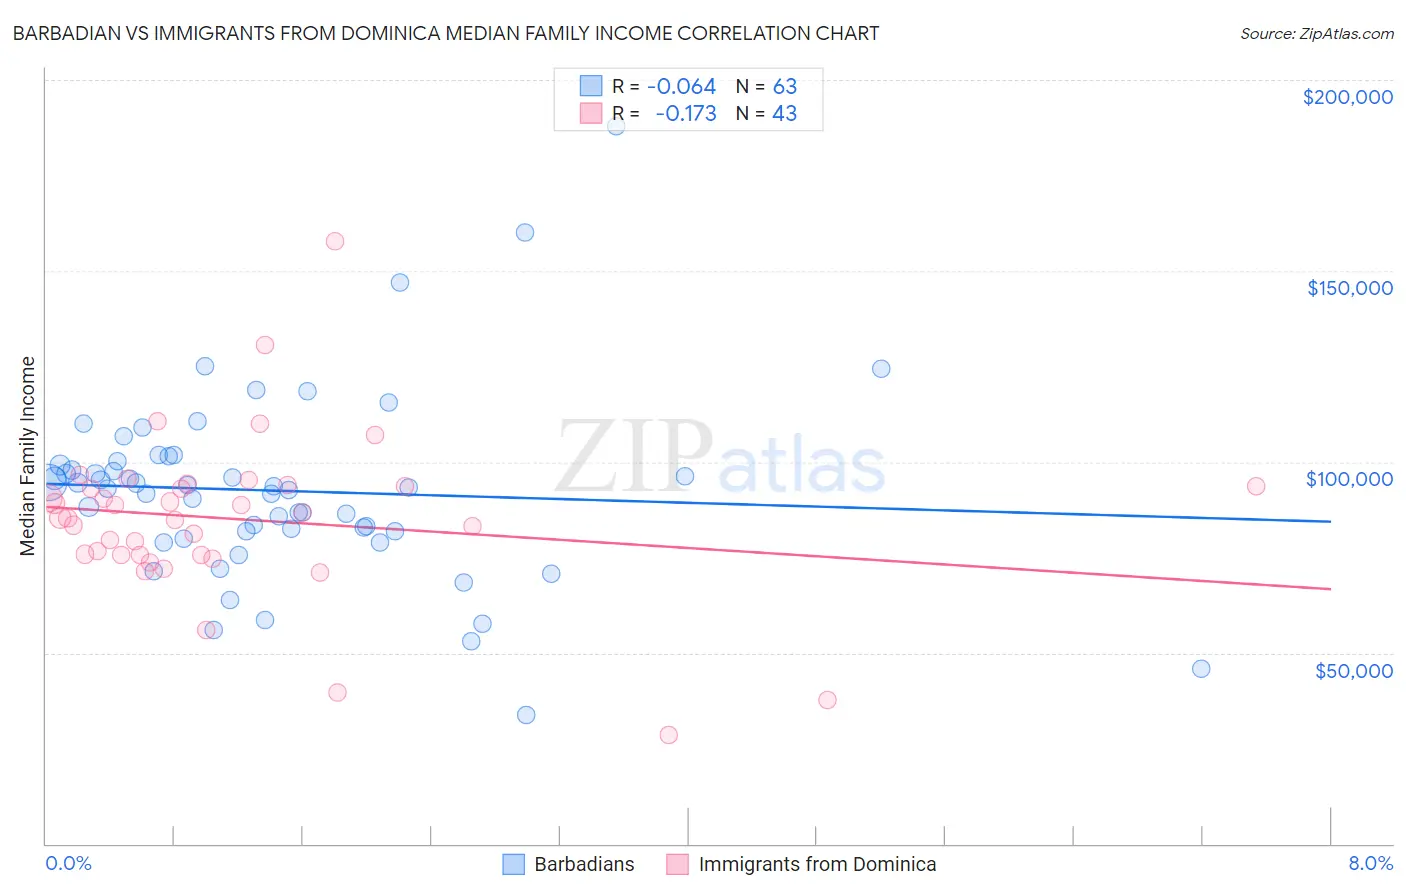
Barbadian vs Immigrants from Dominica Median Family Income Correlation Chart
The statistical analysis conducted on geographies consisting of 141,221,123 people shows a slight negative correlation between the proportion of Barbadians and median family income in the United States with a correlation coefficient (R) of -0.064 and weighted average of $93,919. Similarly, the statistical analysis conducted on geographies consisting of 83,779,139 people shows a poor negative correlation between the proportion of Immigrants from Dominica and median family income in the United States with a correlation coefficient (R) of -0.173 and weighted average of $85,411, a difference of 10.0%.
Median Family Income Correlation Summary
| Measurement | Barbadian | Immigrants from Dominica |
| Minimum | $33,750 | $28,616 |
| Maximum | $188,047 | $157,838 |
| Range | $154,297 | $129,222 |
| Mean | $92,437 | $84,989 |
| Median | $93,405 | $85,349 |
| Interquartile 25% (IQ1) | $81,674 | $75,527 |
| Interquartile 75% (IQ3) | $100,271 | $93,750 |
| Interquartile Range (IQR) | $18,597 | $18,223 |
| Standard Deviation (Sample) | $24,591 | $21,651 |
| Standard Deviation (Population) | $24,395 | $21,398 |
Similar Demographics by Median Family Income
Demographics Similar to Barbadians by Median Family Income
In terms of median family income, the demographic groups most similar to Barbadians are German Russian ($93,858, a difference of 0.060%), Immigrants from Trinidad and Tobago ($93,988, a difference of 0.070%), Somali ($94,085, a difference of 0.18%), Subsaharan African ($93,748, a difference of 0.18%), and Salvadoran ($94,109, a difference of 0.20%).
| Demographics | Rating | Rank | Median Family Income |
| Immigrants | Burma/Myanmar | 1.5 /100 | #235 | Tragic $94,472 |
| Trinidadians and Tobagonians | 1.5 /100 | #236 | Tragic $94,466 |
| Alaskan Athabascans | 1.5 /100 | #237 | Tragic $94,429 |
| Nepalese | 1.3 /100 | #238 | Tragic $94,153 |
| Salvadorans | 1.2 /100 | #239 | Tragic $94,109 |
| Somalis | 1.2 /100 | #240 | Tragic $94,085 |
| Immigrants | Trinidad and Tobago | 1.2 /100 | #241 | Tragic $93,988 |
| Barbadians | 1.1 /100 | #242 | Tragic $93,919 |
| German Russians | 1.1 /100 | #243 | Tragic $93,858 |
| Sub-Saharan Africans | 1.0 /100 | #244 | Tragic $93,748 |
| Immigrants | Middle Africa | 1.0 /100 | #245 | Tragic $93,593 |
| Guyanese | 0.9 /100 | #246 | Tragic $93,373 |
| Immigrants | Senegal | 0.7 /100 | #247 | Tragic $92,912 |
| French American Indians | 0.7 /100 | #248 | Tragic $92,872 |
| Immigrants | Ecuador | 0.7 /100 | #249 | Tragic $92,837 |
Demographics Similar to Immigrants from Dominica by Median Family Income
In terms of median family income, the demographic groups most similar to Immigrants from Dominica are Paiute ($85,414, a difference of 0.0%), Chickasaw ($85,356, a difference of 0.060%), U.S. Virgin Islander ($85,294, a difference of 0.14%), Haitian ($85,218, a difference of 0.23%), and Mexican ($85,618, a difference of 0.24%).
| Demographics | Rating | Rank | Median Family Income |
| Chippewa | 0.0 /100 | #299 | Tragic $86,852 |
| Ottawa | 0.0 /100 | #300 | Tragic $86,380 |
| Colville | 0.0 /100 | #301 | Tragic $85,792 |
| Spanish American Indians | 0.0 /100 | #302 | Tragic $85,728 |
| Hispanics or Latinos | 0.0 /100 | #303 | Tragic $85,647 |
| Mexicans | 0.0 /100 | #304 | Tragic $85,618 |
| Paiute | 0.0 /100 | #305 | Tragic $85,414 |
| Immigrants | Dominica | 0.0 /100 | #306 | Tragic $85,411 |
| Chickasaw | 0.0 /100 | #307 | Tragic $85,356 |
| U.S. Virgin Islanders | 0.0 /100 | #308 | Tragic $85,294 |
| Haitians | 0.0 /100 | #309 | Tragic $85,218 |
| Immigrants | Central America | 0.0 /100 | #310 | Tragic $85,050 |
| Hondurans | 0.0 /100 | #311 | Tragic $85,004 |
| Cubans | 0.0 /100 | #312 | Tragic $84,981 |
| Choctaw | 0.0 /100 | #313 | Tragic $84,835 |