Barbadian vs Immigrants from Yemen Median Family Income
COMPARE
Barbadian
Immigrants from Yemen
Median Family Income
Median Family Income Comparison
Barbadians
Immigrants from Yemen
$93,919
MEDIAN FAMILY INCOME
1.1/ 100
METRIC RATING
242nd/ 347
METRIC RANK
$77,457
MEDIAN FAMILY INCOME
0.0/ 100
METRIC RATING
338th/ 347
METRIC RANK
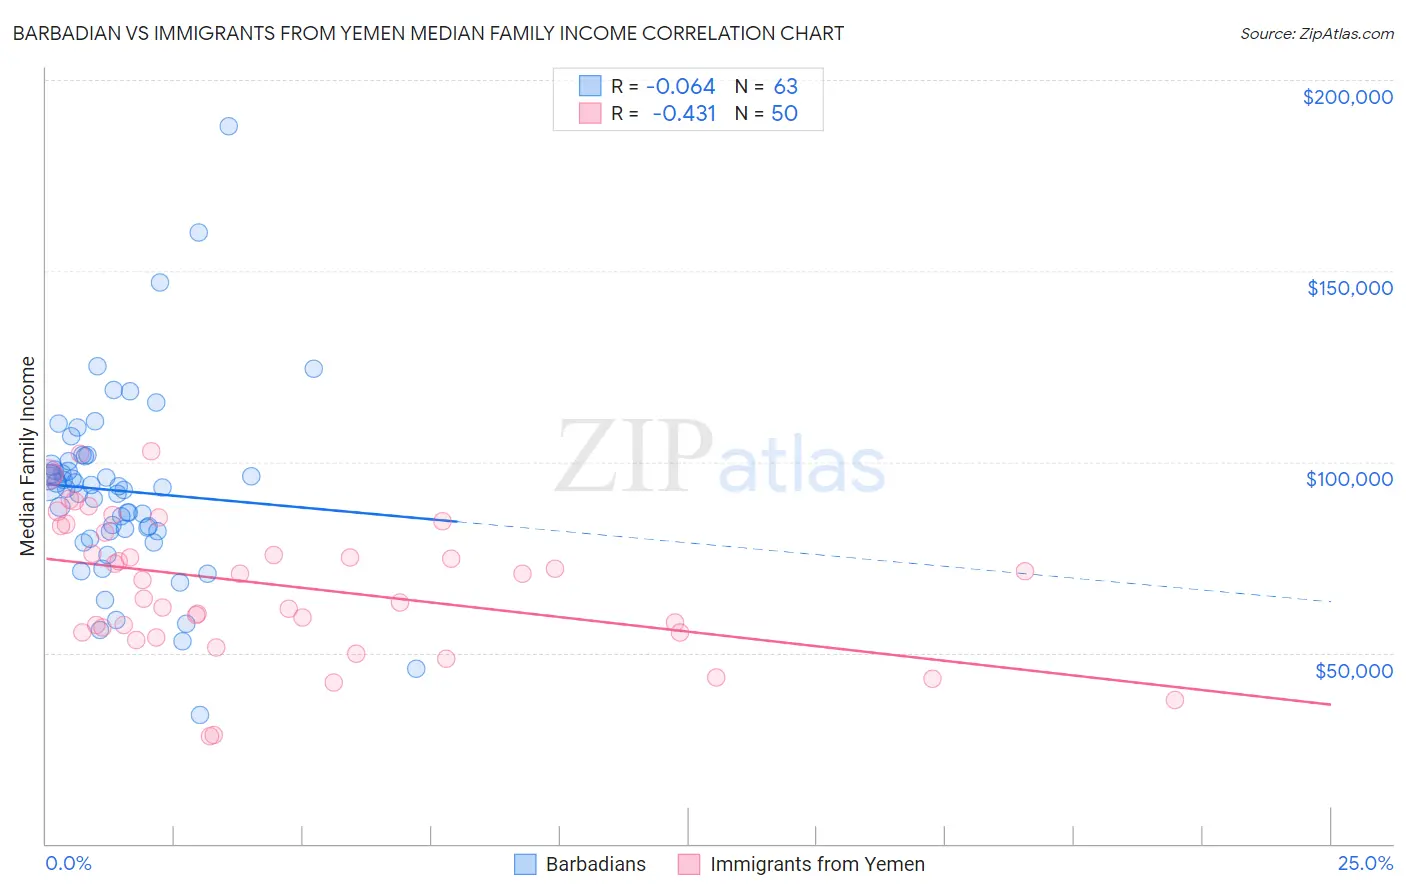
Barbadian vs Immigrants from Yemen Median Family Income Correlation Chart
The statistical analysis conducted on geographies consisting of 141,221,123 people shows a slight negative correlation between the proportion of Barbadians and median family income in the United States with a correlation coefficient (R) of -0.064 and weighted average of $93,919. Similarly, the statistical analysis conducted on geographies consisting of 82,428,654 people shows a moderate negative correlation between the proportion of Immigrants from Yemen and median family income in the United States with a correlation coefficient (R) of -0.431 and weighted average of $77,457, a difference of 21.2%.
Median Family Income Correlation Summary
| Measurement | Barbadian | Immigrants from Yemen |
| Minimum | $33,750 | $28,000 |
| Maximum | $188,047 | $102,670 |
| Range | $154,297 | $74,670 |
| Mean | $92,437 | $67,712 |
| Median | $93,405 | $69,869 |
| Interquartile 25% (IQ1) | $81,674 | $55,430 |
| Interquartile 75% (IQ3) | $100,271 | $83,169 |
| Interquartile Range (IQR) | $18,597 | $27,739 |
| Standard Deviation (Sample) | $24,591 | $18,166 |
| Standard Deviation (Population) | $24,395 | $17,984 |
Similar Demographics by Median Family Income
Demographics Similar to Barbadians by Median Family Income
In terms of median family income, the demographic groups most similar to Barbadians are German Russian ($93,858, a difference of 0.060%), Immigrants from Trinidad and Tobago ($93,988, a difference of 0.070%), Somali ($94,085, a difference of 0.18%), Subsaharan African ($93,748, a difference of 0.18%), and Salvadoran ($94,109, a difference of 0.20%).
| Demographics | Rating | Rank | Median Family Income |
| Immigrants | Burma/Myanmar | 1.5 /100 | #235 | Tragic $94,472 |
| Trinidadians and Tobagonians | 1.5 /100 | #236 | Tragic $94,466 |
| Alaskan Athabascans | 1.5 /100 | #237 | Tragic $94,429 |
| Nepalese | 1.3 /100 | #238 | Tragic $94,153 |
| Salvadorans | 1.2 /100 | #239 | Tragic $94,109 |
| Somalis | 1.2 /100 | #240 | Tragic $94,085 |
| Immigrants | Trinidad and Tobago | 1.2 /100 | #241 | Tragic $93,988 |
| Barbadians | 1.1 /100 | #242 | Tragic $93,919 |
| German Russians | 1.1 /100 | #243 | Tragic $93,858 |
| Sub-Saharan Africans | 1.0 /100 | #244 | Tragic $93,748 |
| Immigrants | Middle Africa | 1.0 /100 | #245 | Tragic $93,593 |
| Guyanese | 0.9 /100 | #246 | Tragic $93,373 |
| Immigrants | Senegal | 0.7 /100 | #247 | Tragic $92,912 |
| French American Indians | 0.7 /100 | #248 | Tragic $92,872 |
| Immigrants | Ecuador | 0.7 /100 | #249 | Tragic $92,837 |
Demographics Similar to Immigrants from Yemen by Median Family Income
In terms of median family income, the demographic groups most similar to Immigrants from Yemen are Pima ($77,431, a difference of 0.030%), Hopi ($77,188, a difference of 0.35%), Pueblo ($76,880, a difference of 0.75%), Yuman ($78,055, a difference of 0.77%), and Immigrants from Cuba ($78,249, a difference of 1.0%).
| Demographics | Rating | Rank | Median Family Income |
| Immigrants | Dominican Republic | 0.0 /100 | #331 | Tragic $81,233 |
| Natives/Alaskans | 0.0 /100 | #332 | Tragic $80,908 |
| Kiowa | 0.0 /100 | #333 | Tragic $80,885 |
| Menominee | 0.0 /100 | #334 | Tragic $79,563 |
| Yup'ik | 0.0 /100 | #335 | Tragic $79,290 |
| Immigrants | Cuba | 0.0 /100 | #336 | Tragic $78,249 |
| Yuman | 0.0 /100 | #337 | Tragic $78,055 |
| Immigrants | Yemen | 0.0 /100 | #338 | Tragic $77,457 |
| Pima | 0.0 /100 | #339 | Tragic $77,431 |
| Hopi | 0.0 /100 | #340 | Tragic $77,188 |
| Pueblo | 0.0 /100 | #341 | Tragic $76,880 |
| Crow | 0.0 /100 | #342 | Tragic $76,605 |
| Houma | 0.0 /100 | #343 | Tragic $76,188 |
| Tohono O'odham | 0.0 /100 | #344 | Tragic $72,193 |
| Navajo | 0.0 /100 | #345 | Tragic $70,989 |