Immigrants from Congo vs Immigrants from Dominica Median Family Income
COMPARE
Immigrants from Congo
Immigrants from Dominica
Median Family Income
Median Family Income Comparison
Immigrants from Congo
Immigrants from Dominica
$82,216
MEDIAN FAMILY INCOME
0.0/ 100
METRIC RATING
326th/ 347
METRIC RANK
$85,411
MEDIAN FAMILY INCOME
0.0/ 100
METRIC RATING
306th/ 347
METRIC RANK
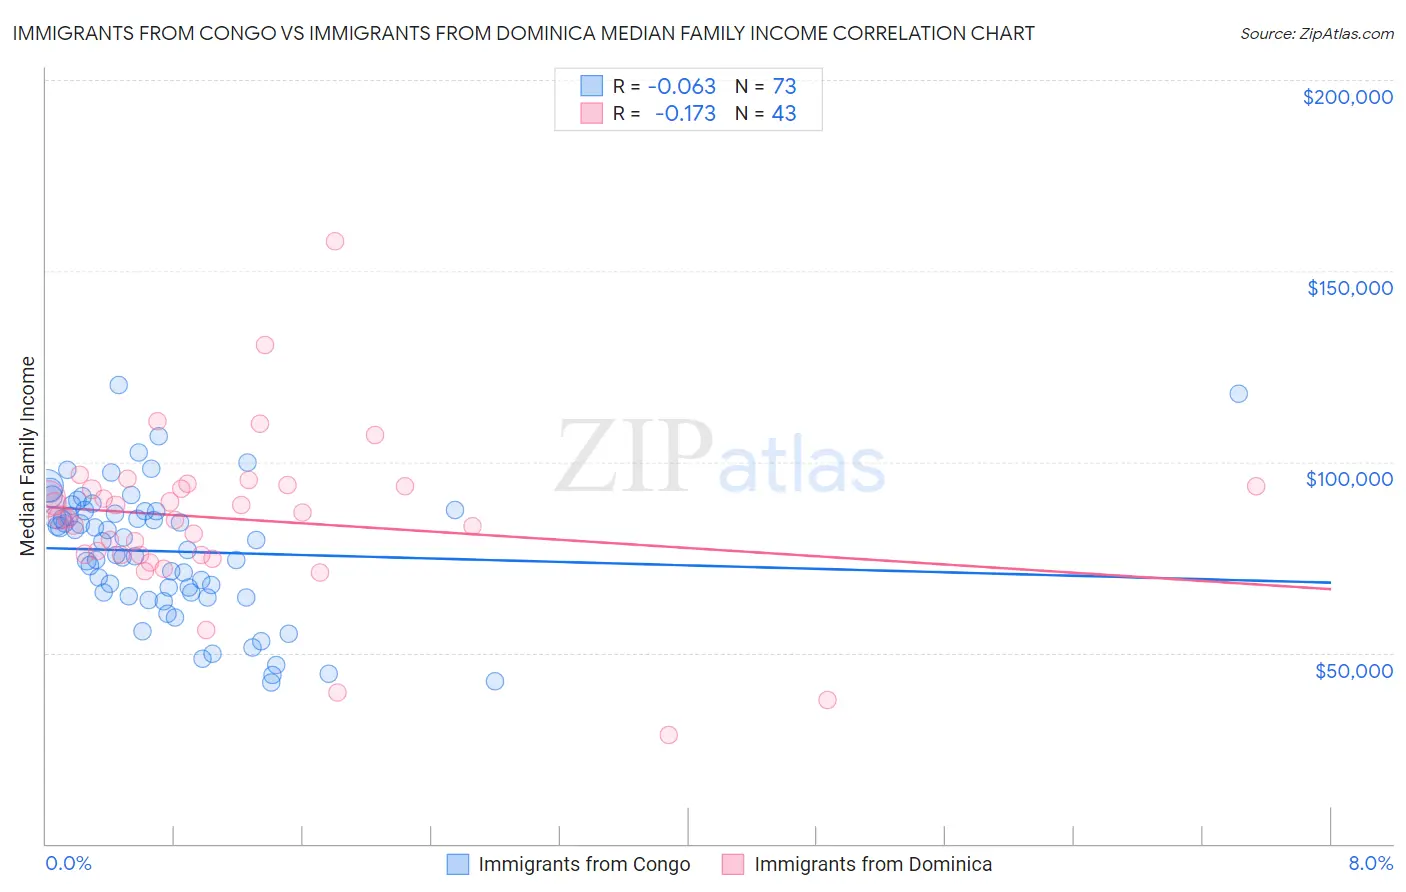
Immigrants from Congo vs Immigrants from Dominica Median Family Income Correlation Chart
The statistical analysis conducted on geographies consisting of 92,050,082 people shows a slight negative correlation between the proportion of Immigrants from Congo and median family income in the United States with a correlation coefficient (R) of -0.063 and weighted average of $82,216. Similarly, the statistical analysis conducted on geographies consisting of 83,779,139 people shows a poor negative correlation between the proportion of Immigrants from Dominica and median family income in the United States with a correlation coefficient (R) of -0.173 and weighted average of $85,411, a difference of 3.9%.
Median Family Income Correlation Summary
| Measurement | Immigrants from Congo | Immigrants from Dominica |
| Minimum | $42,229 | $28,616 |
| Maximum | $120,257 | $157,838 |
| Range | $78,028 | $129,222 |
| Mean | $76,553 | $84,989 |
| Median | $79,188 | $85,349 |
| Interquartile 25% (IQ1) | $65,174 | $75,527 |
| Interquartile 75% (IQ3) | $87,165 | $93,750 |
| Interquartile Range (IQR) | $21,991 | $18,223 |
| Standard Deviation (Sample) | $17,096 | $21,651 |
| Standard Deviation (Population) | $16,978 | $21,398 |
Demographics Similar to Immigrants from Congo and Immigrants from Dominica by Median Family Income
In terms of median family income, the demographic groups most similar to Immigrants from Congo are Sioux ($82,386, a difference of 0.21%), Creek ($82,560, a difference of 0.42%), Bahamian ($82,631, a difference of 0.51%), Dominican ($82,888, a difference of 0.82%), and Immigrants from Caribbean ($83,319, a difference of 1.3%). Similarly, the demographic groups most similar to Immigrants from Dominica are Chickasaw ($85,356, a difference of 0.060%), U.S. Virgin Islander ($85,294, a difference of 0.14%), Haitian ($85,218, a difference of 0.23%), Immigrants from Central America ($85,050, a difference of 0.42%), and Honduran ($85,004, a difference of 0.48%).
| Demographics | Rating | Rank | Median Family Income |
| Immigrants | Dominica | 0.0 /100 | #306 | Tragic $85,411 |
| Chickasaw | 0.0 /100 | #307 | Tragic $85,356 |
| U.S. Virgin Islanders | 0.0 /100 | #308 | Tragic $85,294 |
| Haitians | 0.0 /100 | #309 | Tragic $85,218 |
| Immigrants | Central America | 0.0 /100 | #310 | Tragic $85,050 |
| Hondurans | 0.0 /100 | #311 | Tragic $85,004 |
| Cubans | 0.0 /100 | #312 | Tragic $84,981 |
| Choctaw | 0.0 /100 | #313 | Tragic $84,835 |
| Immigrants | Bahamas | 0.0 /100 | #314 | Tragic $84,732 |
| Apache | 0.0 /100 | #315 | Tragic $84,451 |
| Immigrants | Haiti | 0.0 /100 | #316 | Tragic $84,018 |
| Yakama | 0.0 /100 | #317 | Tragic $83,932 |
| Immigrants | Mexico | 0.0 /100 | #318 | Tragic $83,639 |
| Immigrants | Honduras | 0.0 /100 | #319 | Tragic $83,618 |
| Seminole | 0.0 /100 | #320 | Tragic $83,354 |
| Immigrants | Caribbean | 0.0 /100 | #321 | Tragic $83,319 |
| Dominicans | 0.0 /100 | #322 | Tragic $82,888 |
| Bahamians | 0.0 /100 | #323 | Tragic $82,631 |
| Creek | 0.0 /100 | #324 | Tragic $82,560 |
| Sioux | 0.0 /100 | #325 | Tragic $82,386 |
| Immigrants | Congo | 0.0 /100 | #326 | Tragic $82,216 |