Immigrants from Jordan vs Immigrants from Dominica Median Family Income
COMPARE
Immigrants from Jordan
Immigrants from Dominica
Median Family Income
Median Family Income Comparison
Immigrants from Jordan
Immigrants from Dominica
$107,715
MEDIAN FAMILY INCOME
92.9/ 100
METRIC RATING
122nd/ 347
METRIC RANK
$85,411
MEDIAN FAMILY INCOME
0.0/ 100
METRIC RATING
306th/ 347
METRIC RANK
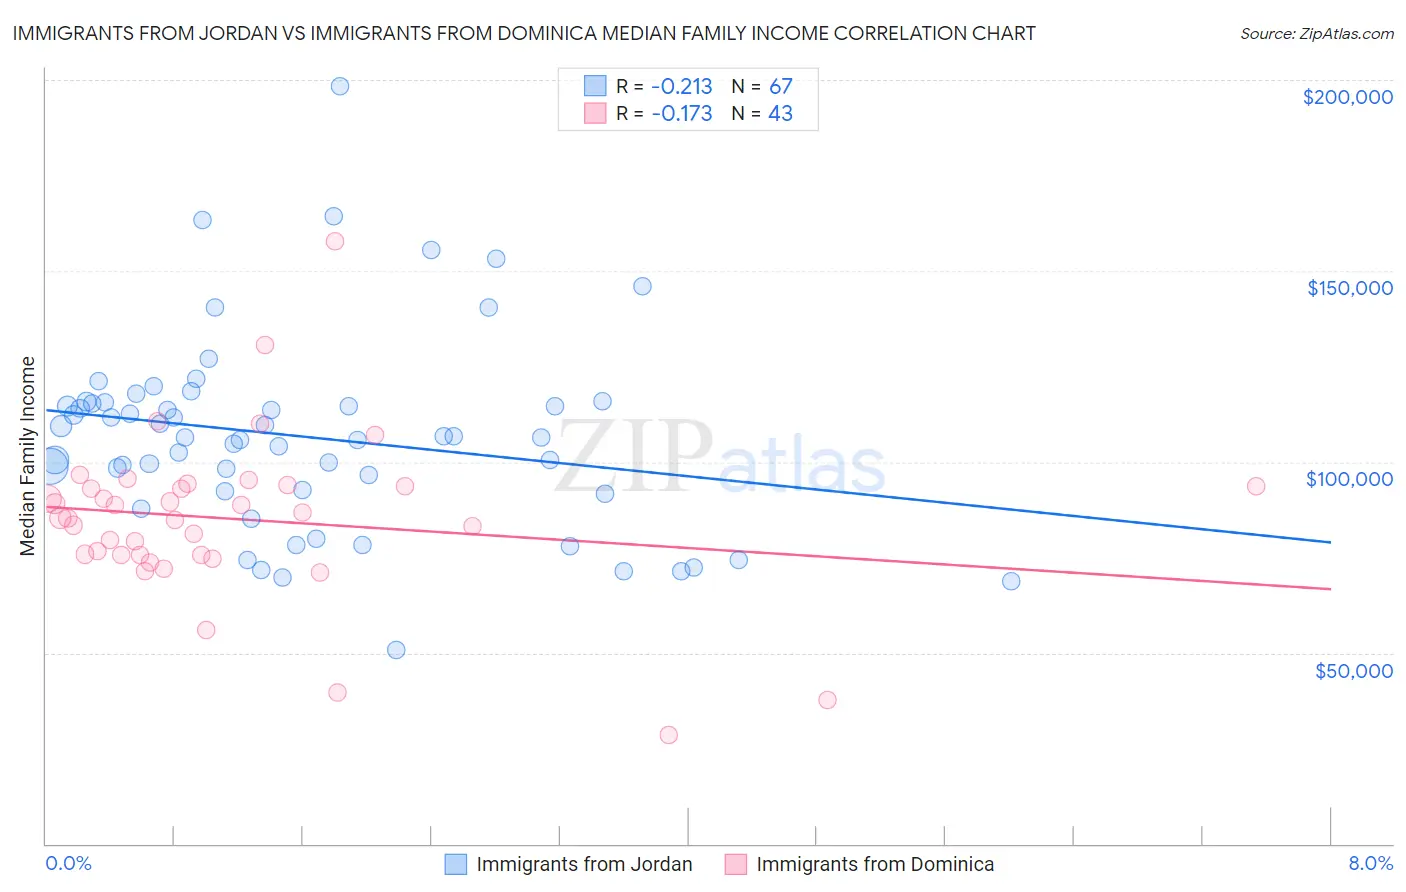
Immigrants from Jordan vs Immigrants from Dominica Median Family Income Correlation Chart
The statistical analysis conducted on geographies consisting of 181,223,835 people shows a weak negative correlation between the proportion of Immigrants from Jordan and median family income in the United States with a correlation coefficient (R) of -0.213 and weighted average of $107,715. Similarly, the statistical analysis conducted on geographies consisting of 83,779,139 people shows a poor negative correlation between the proportion of Immigrants from Dominica and median family income in the United States with a correlation coefficient (R) of -0.173 and weighted average of $85,411, a difference of 26.1%.
Median Family Income Correlation Summary
| Measurement | Immigrants from Jordan | Immigrants from Dominica |
| Minimum | $50,608 | $28,616 |
| Maximum | $198,467 | $157,838 |
| Range | $147,858 | $129,222 |
| Mean | $106,593 | $84,989 |
| Median | $106,540 | $85,349 |
| Interquartile 25% (IQ1) | $92,338 | $75,527 |
| Interquartile 75% (IQ3) | $115,517 | $93,750 |
| Interquartile Range (IQR) | $23,179 | $18,223 |
| Standard Deviation (Sample) | $25,689 | $21,651 |
| Standard Deviation (Population) | $25,497 | $21,398 |
Similar Demographics by Median Family Income
Demographics Similar to Immigrants from Jordan by Median Family Income
In terms of median family income, the demographic groups most similar to Immigrants from Jordan are Carpatho Rusyn ($107,502, a difference of 0.20%), Pakistani ($107,390, a difference of 0.30%), European ($108,099, a difference of 0.36%), Taiwanese ($107,295, a difference of 0.39%), and Immigrants from Northern Africa ($108,161, a difference of 0.41%).
| Demographics | Rating | Rank | Median Family Income |
| Swedes | 95.1 /100 | #115 | Exceptional $108,499 |
| Chileans | 95.0 /100 | #116 | Exceptional $108,429 |
| Immigrants | Philippines | 94.6 /100 | #117 | Exceptional $108,288 |
| Ethiopians | 94.5 /100 | #118 | Exceptional $108,251 |
| Sri Lankans | 94.5 /100 | #119 | Exceptional $108,234 |
| Immigrants | Northern Africa | 94.3 /100 | #120 | Exceptional $108,161 |
| Europeans | 94.1 /100 | #121 | Exceptional $108,099 |
| Immigrants | Jordan | 92.9 /100 | #122 | Exceptional $107,715 |
| Carpatho Rusyns | 92.2 /100 | #123 | Exceptional $107,502 |
| Pakistanis | 91.7 /100 | #124 | Exceptional $107,390 |
| Taiwanese | 91.4 /100 | #125 | Exceptional $107,295 |
| Serbians | 90.8 /100 | #126 | Exceptional $107,157 |
| Lebanese | 90.5 /100 | #127 | Exceptional $107,086 |
| Immigrants | Ethiopia | 90.0 /100 | #128 | Excellent $106,969 |
| Arabs | 89.9 /100 | #129 | Excellent $106,952 |
Demographics Similar to Immigrants from Dominica by Median Family Income
In terms of median family income, the demographic groups most similar to Immigrants from Dominica are Paiute ($85,414, a difference of 0.0%), Chickasaw ($85,356, a difference of 0.060%), U.S. Virgin Islander ($85,294, a difference of 0.14%), Haitian ($85,218, a difference of 0.23%), and Mexican ($85,618, a difference of 0.24%).
| Demographics | Rating | Rank | Median Family Income |
| Chippewa | 0.0 /100 | #299 | Tragic $86,852 |
| Ottawa | 0.0 /100 | #300 | Tragic $86,380 |
| Colville | 0.0 /100 | #301 | Tragic $85,792 |
| Spanish American Indians | 0.0 /100 | #302 | Tragic $85,728 |
| Hispanics or Latinos | 0.0 /100 | #303 | Tragic $85,647 |
| Mexicans | 0.0 /100 | #304 | Tragic $85,618 |
| Paiute | 0.0 /100 | #305 | Tragic $85,414 |
| Immigrants | Dominica | 0.0 /100 | #306 | Tragic $85,411 |
| Chickasaw | 0.0 /100 | #307 | Tragic $85,356 |
| U.S. Virgin Islanders | 0.0 /100 | #308 | Tragic $85,294 |
| Haitians | 0.0 /100 | #309 | Tragic $85,218 |
| Immigrants | Central America | 0.0 /100 | #310 | Tragic $85,050 |
| Hondurans | 0.0 /100 | #311 | Tragic $85,004 |
| Cubans | 0.0 /100 | #312 | Tragic $84,981 |
| Choctaw | 0.0 /100 | #313 | Tragic $84,835 |