Asian vs Paiute Wage/Income Gap
COMPARE
Asian
Paiute
Wage/Income Gap
Wage/Income Gap Comparison
Asians
Paiute
26.9%
WAGE/INCOME GAP
5.9/ 100
METRIC RATING
226th/ 347
METRIC RANK
25.5%
WAGE/INCOME GAP
62.9/ 100
METRIC RATING
167th/ 347
METRIC RANK
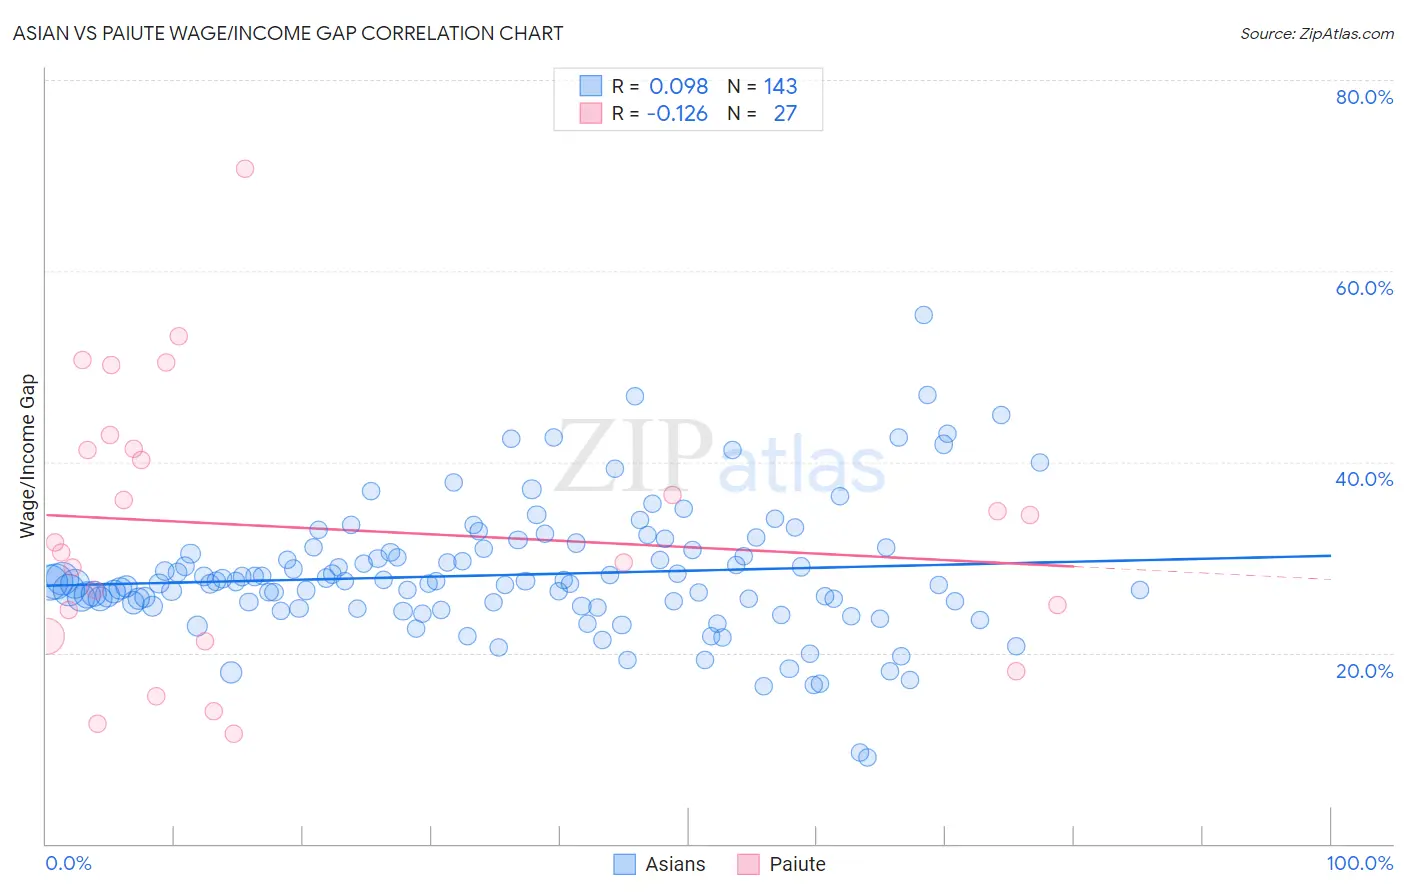
Asian vs Paiute Wage/Income Gap Correlation Chart
The statistical analysis conducted on geographies consisting of 549,374,424 people shows a slight positive correlation between the proportion of Asians and wage/income gap percentage in the United States with a correlation coefficient (R) of 0.098 and weighted average of 26.9%. Similarly, the statistical analysis conducted on geographies consisting of 58,365,830 people shows a poor negative correlation between the proportion of Paiute and wage/income gap percentage in the United States with a correlation coefficient (R) of -0.126 and weighted average of 25.5%, a difference of 5.4%.
Wage/Income Gap Correlation Summary
| Measurement | Asian | Paiute |
| Minimum | 9.1% | 11.5% |
| Maximum | 55.3% | 70.8% |
| Range | 46.3% | 59.2% |
| Mean | 28.2% | 33.1% |
| Median | 27.4% | 31.6% |
| Interquartile 25% (IQ1) | 24.9% | 21.7% |
| Interquartile 75% (IQ3) | 30.8% | 41.4% |
| Interquartile Range (IQR) | 5.9% | 19.6% |
| Standard Deviation (Sample) | 6.8% | 14.3% |
| Standard Deviation (Population) | 6.8% | 14.0% |
Similar Demographics by Wage/Income Gap
Demographics Similar to Asians by Wage/Income Gap
In terms of wage/income gap, the demographic groups most similar to Asians are Spaniard (27.0%, a difference of 0.080%), Immigrants from Turkey (27.0%, a difference of 0.080%), Immigrants from Asia (27.0%, a difference of 0.11%), Ottawa (27.0%, a difference of 0.16%), and Immigrants from Ireland (26.9%, a difference of 0.17%).
| Demographics | Rating | Rank | Wage/Income Gap |
| Immigrants | Poland | 8.9 /100 | #219 | Tragic 26.7% |
| Immigrants | Latvia | 8.9 /100 | #220 | Tragic 26.7% |
| Immigrants | Spain | 8.5 /100 | #221 | Tragic 26.8% |
| Bolivians | 8.3 /100 | #222 | Tragic 26.8% |
| Jordanians | 8.0 /100 | #223 | Tragic 26.8% |
| Immigrants | Argentina | 7.2 /100 | #224 | Tragic 26.8% |
| Immigrants | Ireland | 6.5 /100 | #225 | Tragic 26.9% |
| Asians | 5.9 /100 | #226 | Tragic 26.9% |
| Spaniards | 5.6 /100 | #227 | Tragic 27.0% |
| Immigrants | Turkey | 5.6 /100 | #228 | Tragic 27.0% |
| Immigrants | Asia | 5.5 /100 | #229 | Tragic 27.0% |
| Ottawa | 5.3 /100 | #230 | Tragic 27.0% |
| Bhutanese | 5.3 /100 | #231 | Tragic 27.0% |
| Argentineans | 5.2 /100 | #232 | Tragic 27.0% |
| Immigrants | Brazil | 5.0 /100 | #233 | Tragic 27.0% |
Demographics Similar to Paiute by Wage/Income Gap
In terms of wage/income gap, the demographic groups most similar to Paiute are Seminole (25.6%, a difference of 0.020%), Immigrants from Ukraine (25.5%, a difference of 0.060%), Immigrants from Hong Kong (25.5%, a difference of 0.070%), Peruvian (25.6%, a difference of 0.20%), and Immigrants from Oceania (25.6%, a difference of 0.37%).
| Demographics | Rating | Rank | Wage/Income Gap |
| French American Indians | 72.5 /100 | #160 | Good 25.4% |
| Albanians | 69.4 /100 | #161 | Good 25.4% |
| Shoshone | 69.0 /100 | #162 | Good 25.4% |
| Native Hawaiians | 69.0 /100 | #163 | Good 25.4% |
| Koreans | 68.6 /100 | #164 | Good 25.4% |
| Immigrants | Hong Kong | 64.0 /100 | #165 | Good 25.5% |
| Immigrants | Ukraine | 63.8 /100 | #166 | Good 25.5% |
| Paiute | 62.9 /100 | #167 | Good 25.5% |
| Seminole | 62.6 /100 | #168 | Good 25.6% |
| Peruvians | 60.1 /100 | #169 | Good 25.6% |
| Immigrants | Oceania | 57.5 /100 | #170 | Average 25.6% |
| Immigrants | Greece | 56.6 /100 | #171 | Average 25.7% |
| Immigrants | Chile | 53.2 /100 | #172 | Average 25.7% |
| Immigrants | Belarus | 52.9 /100 | #173 | Average 25.7% |
| Alaskan Athabascans | 50.0 /100 | #174 | Average 25.8% |