Asian vs Aleut Wage/Income Gap
COMPARE
Asian
Aleut
Wage/Income Gap
Wage/Income Gap Comparison
Asians
Aleuts
26.9%
WAGE/INCOME GAP
5.9/ 100
METRIC RATING
226th/ 347
METRIC RANK
23.7%
WAGE/INCOME GAP
99.2/ 100
METRIC RATING
99th/ 347
METRIC RANK
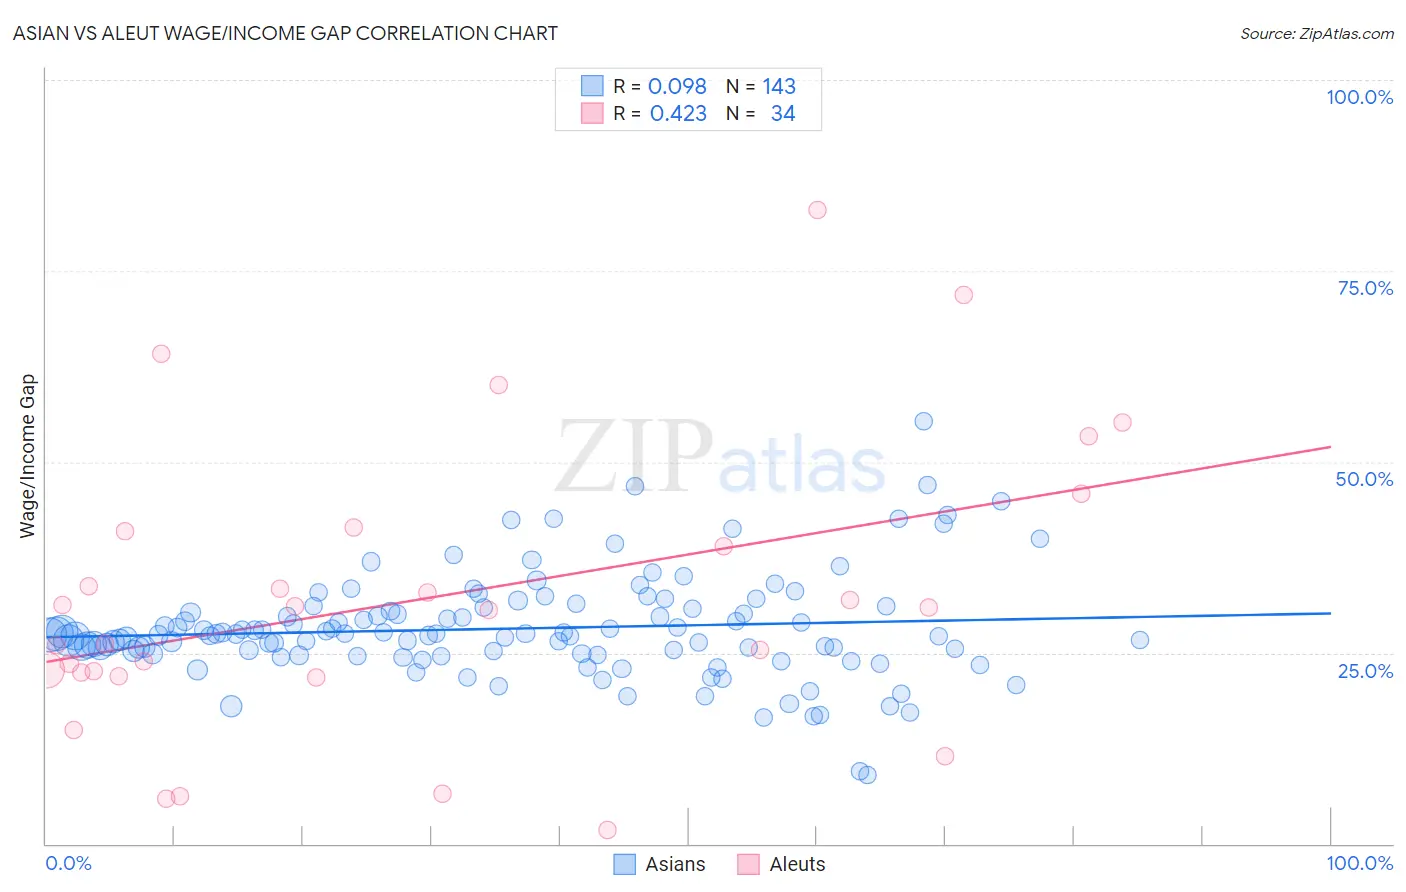
Asian vs Aleut Wage/Income Gap Correlation Chart
The statistical analysis conducted on geographies consisting of 549,374,424 people shows a slight positive correlation between the proportion of Asians and wage/income gap percentage in the United States with a correlation coefficient (R) of 0.098 and weighted average of 26.9%. Similarly, the statistical analysis conducted on geographies consisting of 61,745,679 people shows a moderate positive correlation between the proportion of Aleuts and wage/income gap percentage in the United States with a correlation coefficient (R) of 0.423 and weighted average of 23.7%, a difference of 13.4%.
Wage/Income Gap Correlation Summary
| Measurement | Asian | Aleut |
| Minimum | 9.1% | 1.9% |
| Maximum | 55.3% | 83.0% |
| Range | 46.3% | 81.1% |
| Mean | 28.2% | 32.2% |
| Median | 27.4% | 30.8% |
| Interquartile 25% (IQ1) | 24.9% | 22.4% |
| Interquartile 75% (IQ3) | 30.8% | 41.0% |
| Interquartile Range (IQR) | 5.9% | 18.6% |
| Standard Deviation (Sample) | 6.8% | 18.9% |
| Standard Deviation (Population) | 6.8% | 18.6% |
Similar Demographics by Wage/Income Gap
Demographics Similar to Asians by Wage/Income Gap
In terms of wage/income gap, the demographic groups most similar to Asians are Spaniard (27.0%, a difference of 0.080%), Immigrants from Turkey (27.0%, a difference of 0.080%), Immigrants from Asia (27.0%, a difference of 0.11%), Ottawa (27.0%, a difference of 0.16%), and Immigrants from Ireland (26.9%, a difference of 0.17%).
| Demographics | Rating | Rank | Wage/Income Gap |
| Immigrants | Poland | 8.9 /100 | #219 | Tragic 26.7% |
| Immigrants | Latvia | 8.9 /100 | #220 | Tragic 26.7% |
| Immigrants | Spain | 8.5 /100 | #221 | Tragic 26.8% |
| Bolivians | 8.3 /100 | #222 | Tragic 26.8% |
| Jordanians | 8.0 /100 | #223 | Tragic 26.8% |
| Immigrants | Argentina | 7.2 /100 | #224 | Tragic 26.8% |
| Immigrants | Ireland | 6.5 /100 | #225 | Tragic 26.9% |
| Asians | 5.9 /100 | #226 | Tragic 26.9% |
| Spaniards | 5.6 /100 | #227 | Tragic 27.0% |
| Immigrants | Turkey | 5.6 /100 | #228 | Tragic 27.0% |
| Immigrants | Asia | 5.5 /100 | #229 | Tragic 27.0% |
| Ottawa | 5.3 /100 | #230 | Tragic 27.0% |
| Bhutanese | 5.3 /100 | #231 | Tragic 27.0% |
| Argentineans | 5.2 /100 | #232 | Tragic 27.0% |
| Immigrants | Brazil | 5.0 /100 | #233 | Tragic 27.0% |
Demographics Similar to Aleuts by Wage/Income Gap
In terms of wage/income gap, the demographic groups most similar to Aleuts are Yakama (23.7%, a difference of 0.020%), Immigrants from Latin America (23.7%, a difference of 0.070%), Japanese (23.8%, a difference of 0.17%), Immigrants from Laos (23.8%, a difference of 0.32%), and Immigrants from Sudan (23.6%, a difference of 0.47%).
| Demographics | Rating | Rank | Wage/Income Gap |
| Immigrants | Honduras | 99.5 /100 | #92 | Exceptional 23.5% |
| Immigrants | Cabo Verde | 99.5 /100 | #93 | Exceptional 23.6% |
| Hondurans | 99.5 /100 | #94 | Exceptional 23.6% |
| Cape Verdeans | 99.4 /100 | #95 | Exceptional 23.6% |
| Kiowa | 99.4 /100 | #96 | Exceptional 23.6% |
| Immigrants | Sudan | 99.4 /100 | #97 | Exceptional 23.6% |
| Immigrants | Latin America | 99.2 /100 | #98 | Exceptional 23.7% |
| Aleuts | 99.2 /100 | #99 | Exceptional 23.7% |
| Yakama | 99.2 /100 | #100 | Exceptional 23.7% |
| Japanese | 99.1 /100 | #101 | Exceptional 23.8% |
| Immigrants | Laos | 99.0 /100 | #102 | Exceptional 23.8% |
| Tsimshian | 98.9 /100 | #103 | Exceptional 23.9% |
| Tlingit-Haida | 98.7 /100 | #104 | Exceptional 24.0% |
| Moroccans | 98.6 /100 | #105 | Exceptional 24.0% |
| Sudanese | 98.6 /100 | #106 | Exceptional 24.0% |