Comanche vs Paiute Wage/Income Gap
COMPARE
Comanche
Paiute
Wage/Income Gap
Wage/Income Gap Comparison
Comanche
Paiute
25.0%
WAGE/INCOME GAP
85.2/ 100
METRIC RATING
145th/ 347
METRIC RANK
25.5%
WAGE/INCOME GAP
62.9/ 100
METRIC RATING
167th/ 347
METRIC RANK
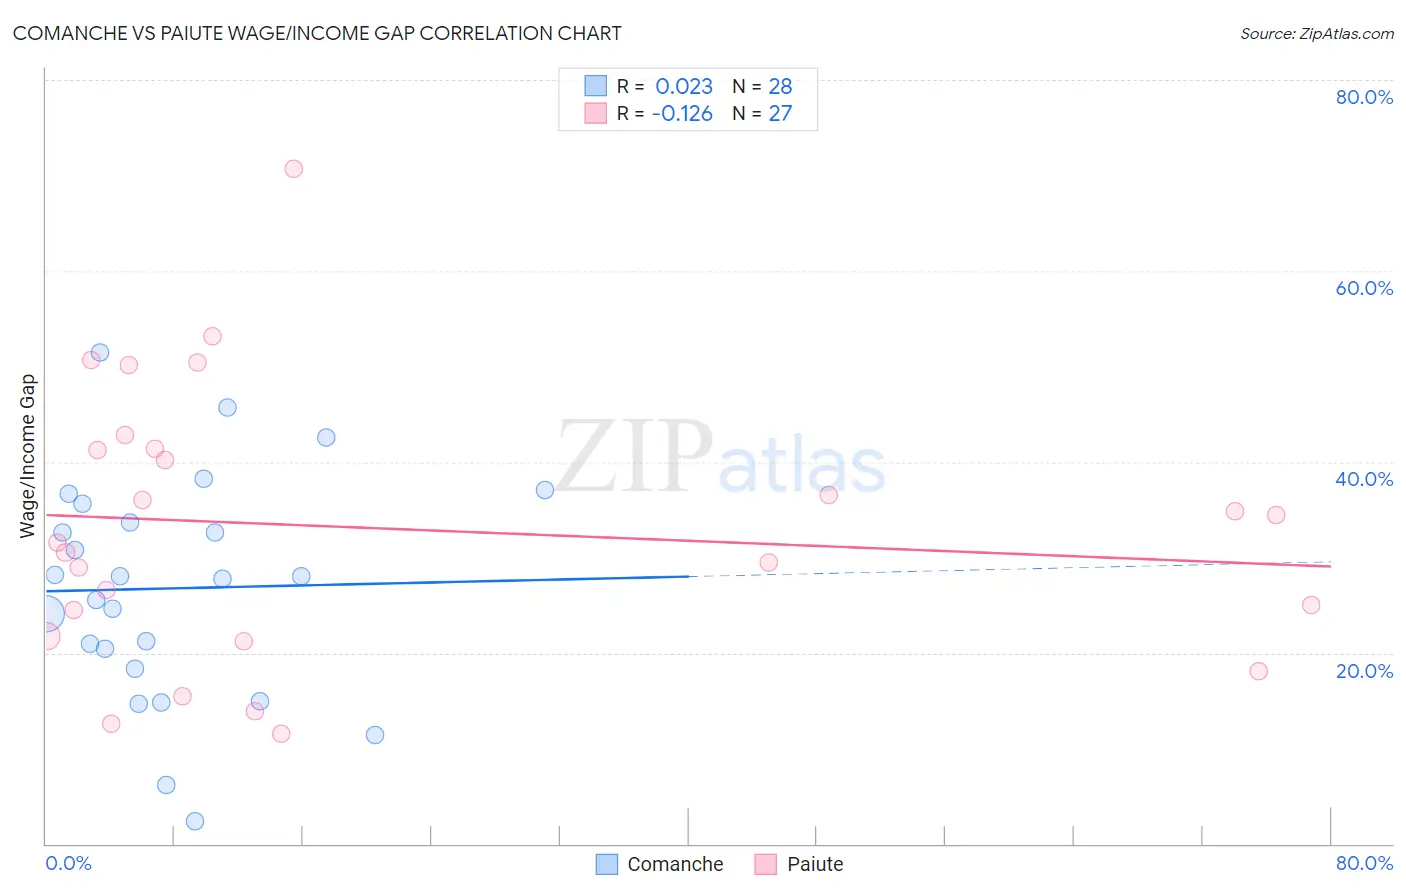
Comanche vs Paiute Wage/Income Gap Correlation Chart
The statistical analysis conducted on geographies consisting of 109,744,354 people shows no correlation between the proportion of Comanche and wage/income gap percentage in the United States with a correlation coefficient (R) of 0.023 and weighted average of 25.0%. Similarly, the statistical analysis conducted on geographies consisting of 58,365,830 people shows a poor negative correlation between the proportion of Paiute and wage/income gap percentage in the United States with a correlation coefficient (R) of -0.126 and weighted average of 25.5%, a difference of 2.1%.
Wage/Income Gap Correlation Summary
| Measurement | Comanche | Paiute |
| Minimum | 2.4% | 11.5% |
| Maximum | 51.5% | 70.8% |
| Range | 49.1% | 59.2% |
| Mean | 26.7% | 33.1% |
| Median | 27.9% | 31.6% |
| Interquartile 25% (IQ1) | 19.4% | 21.7% |
| Interquartile 75% (IQ3) | 34.7% | 41.4% |
| Interquartile Range (IQR) | 15.3% | 19.6% |
| Standard Deviation (Sample) | 11.6% | 14.3% |
| Standard Deviation (Population) | 11.4% | 14.0% |
Similar Demographics by Wage/Income Gap
Demographics Similar to Comanche by Wage/Income Gap
In terms of wage/income gap, the demographic groups most similar to Comanche are South American (25.0%, a difference of 0.0%), Malaysian (25.0%, a difference of 0.030%), Iroquois (25.1%, a difference of 0.16%), Chippewa (25.0%, a difference of 0.24%), and Immigrants from Peru (25.1%, a difference of 0.31%).
| Demographics | Rating | Rank | Wage/Income Gap |
| Immigrants | Bosnia and Herzegovina | 90.1 /100 | #138 | Exceptional 24.8% |
| Hispanics or Latinos | 89.5 /100 | #139 | Excellent 24.9% |
| Immigrants | Nepal | 89.3 /100 | #140 | Excellent 24.9% |
| Hawaiians | 89.3 /100 | #141 | Excellent 24.9% |
| Afghans | 88.1 /100 | #142 | Excellent 24.9% |
| Immigrants | Uganda | 88.0 /100 | #143 | Excellent 24.9% |
| Chippewa | 86.9 /100 | #144 | Excellent 25.0% |
| Comanche | 85.2 /100 | #145 | Excellent 25.0% |
| South Americans | 85.2 /100 | #146 | Excellent 25.0% |
| Malaysians | 84.9 /100 | #147 | Excellent 25.0% |
| Iroquois | 83.9 /100 | #148 | Excellent 25.1% |
| Immigrants | Peru | 82.6 /100 | #149 | Excellent 25.1% |
| Immigrants | Immigrants | 82.3 /100 | #150 | Excellent 25.1% |
| Taiwanese | 81.6 /100 | #151 | Excellent 25.1% |
| Uruguayans | 81.3 /100 | #152 | Excellent 25.2% |
Demographics Similar to Paiute by Wage/Income Gap
In terms of wage/income gap, the demographic groups most similar to Paiute are Seminole (25.6%, a difference of 0.020%), Immigrants from Ukraine (25.5%, a difference of 0.060%), Immigrants from Hong Kong (25.5%, a difference of 0.070%), Peruvian (25.6%, a difference of 0.20%), and Immigrants from Oceania (25.6%, a difference of 0.37%).
| Demographics | Rating | Rank | Wage/Income Gap |
| French American Indians | 72.5 /100 | #160 | Good 25.4% |
| Albanians | 69.4 /100 | #161 | Good 25.4% |
| Shoshone | 69.0 /100 | #162 | Good 25.4% |
| Native Hawaiians | 69.0 /100 | #163 | Good 25.4% |
| Koreans | 68.6 /100 | #164 | Good 25.4% |
| Immigrants | Hong Kong | 64.0 /100 | #165 | Good 25.5% |
| Immigrants | Ukraine | 63.8 /100 | #166 | Good 25.5% |
| Paiute | 62.9 /100 | #167 | Good 25.5% |
| Seminole | 62.6 /100 | #168 | Good 25.6% |
| Peruvians | 60.1 /100 | #169 | Good 25.6% |
| Immigrants | Oceania | 57.5 /100 | #170 | Average 25.6% |
| Immigrants | Greece | 56.6 /100 | #171 | Average 25.7% |
| Immigrants | Chile | 53.2 /100 | #172 | Average 25.7% |
| Immigrants | Belarus | 52.9 /100 | #173 | Average 25.7% |
| Alaskan Athabascans | 50.0 /100 | #174 | Average 25.8% |