Panamanian vs Spanish American Indian Per Capita Income
COMPARE
Panamanian
Spanish American Indian
Per Capita Income
Per Capita Income Comparison
Panamanians
Spanish American Indians
$42,035
PER CAPITA INCOME
13.9/ 100
METRIC RATING
208th/ 347
METRIC RANK
$34,195
PER CAPITA INCOME
0.0/ 100
METRIC RATING
330th/ 347
METRIC RANK
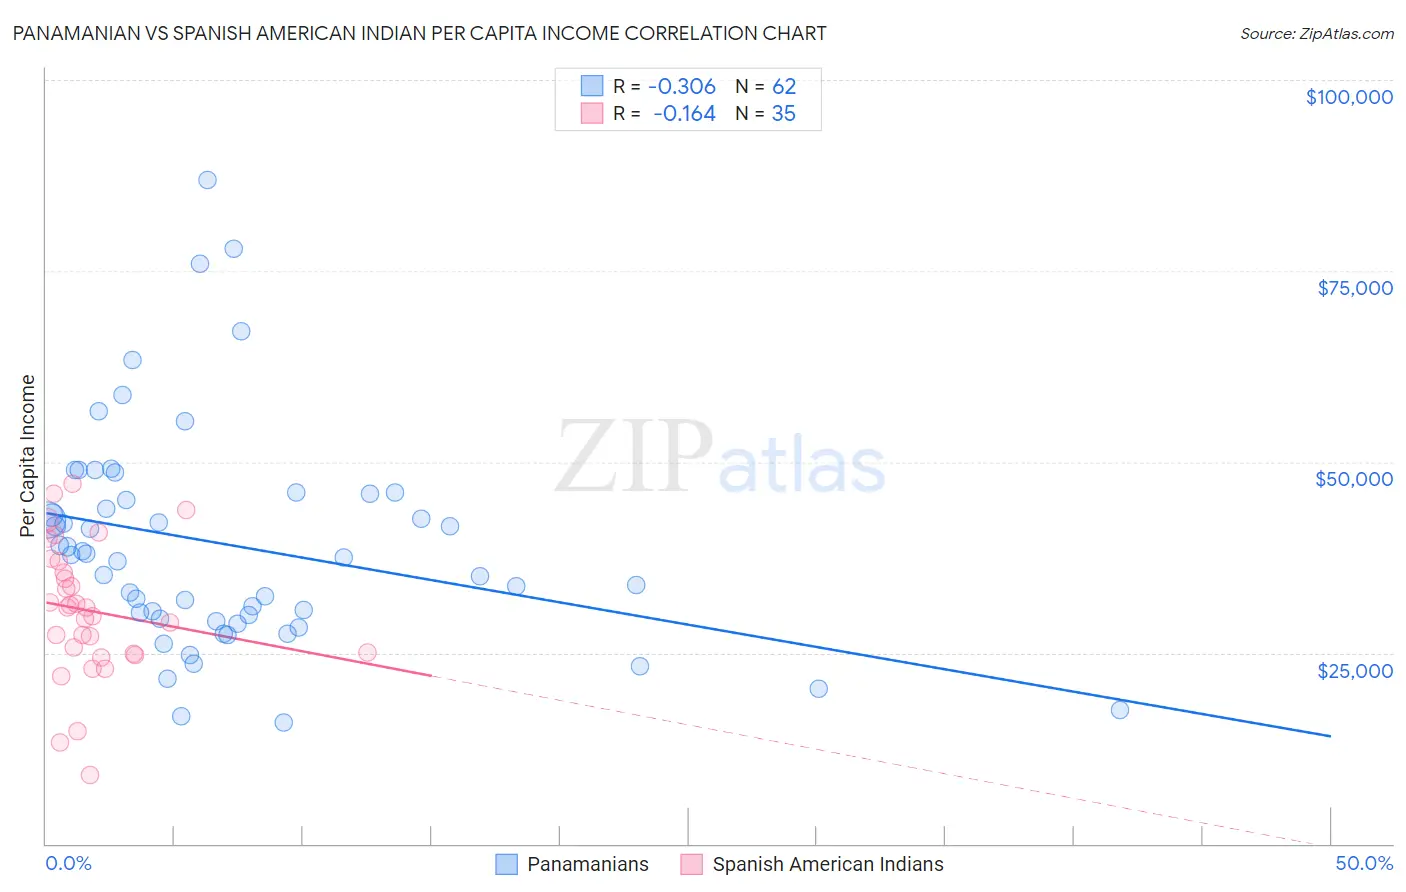
Panamanian vs Spanish American Indian Per Capita Income Correlation Chart
The statistical analysis conducted on geographies consisting of 281,258,630 people shows a mild negative correlation between the proportion of Panamanians and per capita income in the United States with a correlation coefficient (R) of -0.306 and weighted average of $42,035. Similarly, the statistical analysis conducted on geographies consisting of 73,150,359 people shows a poor negative correlation between the proportion of Spanish American Indians and per capita income in the United States with a correlation coefficient (R) of -0.164 and weighted average of $34,195, a difference of 22.9%.
Per Capita Income Correlation Summary
| Measurement | Panamanian | Spanish American Indian |
| Minimum | $15,844 | $9,061 |
| Maximum | $86,907 | $47,199 |
| Range | $71,063 | $38,138 |
| Mean | $39,085 | $30,495 |
| Median | $37,643 | $30,854 |
| Interquartile 25% (IQ1) | $29,415 | $24,953 |
| Interquartile 75% (IQ3) | $45,746 | $37,015 |
| Interquartile Range (IQR) | $16,331 | $12,062 |
| Standard Deviation (Sample) | $14,450 | $8,840 |
| Standard Deviation (Population) | $14,333 | $8,713 |
Similar Demographics by Per Capita Income
Demographics Similar to Panamanians by Per Capita Income
In terms of per capita income, the demographic groups most similar to Panamanians are Venezuelan ($42,074, a difference of 0.090%), Immigrants from Sudan ($41,986, a difference of 0.12%), Ecuadorian ($41,958, a difference of 0.18%), Ghanaian ($42,164, a difference of 0.31%), and White/Caucasian ($42,180, a difference of 0.35%).
| Demographics | Rating | Rank | Per Capita Income |
| Immigrants | Thailand | 17.6 /100 | #201 | Poor $42,289 |
| Immigrants | Bosnia and Herzegovina | 17.5 /100 | #202 | Poor $42,278 |
| Spanish | 17.0 /100 | #203 | Poor $42,249 |
| Aleuts | 16.4 /100 | #204 | Poor $42,210 |
| Whites/Caucasians | 15.9 /100 | #205 | Poor $42,180 |
| Ghanaians | 15.7 /100 | #206 | Poor $42,164 |
| Venezuelans | 14.4 /100 | #207 | Poor $42,074 |
| Panamanians | 13.9 /100 | #208 | Poor $42,035 |
| Immigrants | Sudan | 13.2 /100 | #209 | Poor $41,986 |
| Ecuadorians | 12.9 /100 | #210 | Poor $41,958 |
| Immigrants | Panama | 11.6 /100 | #211 | Poor $41,853 |
| Immigrants | Senegal | 11.3 /100 | #212 | Poor $41,830 |
| Immigrants | Venezuela | 10.2 /100 | #213 | Poor $41,727 |
| Immigrants | Bangladesh | 10.1 /100 | #214 | Poor $41,709 |
| Sudanese | 9.9 /100 | #215 | Tragic $41,695 |
Demographics Similar to Spanish American Indians by Per Capita Income
In terms of per capita income, the demographic groups most similar to Spanish American Indians are Immigrants from Mexico ($33,931, a difference of 0.78%), Sioux ($33,921, a difference of 0.81%), Mexican ($34,559, a difference of 1.1%), Menominee ($34,578, a difference of 1.1%), and Immigrants from Yemen ($33,696, a difference of 1.5%).
| Demographics | Rating | Rank | Per Capita Income |
| Cheyenne | 0.0 /100 | #323 | Tragic $35,276 |
| Kiowa | 0.0 /100 | #324 | Tragic $35,102 |
| Immigrants | Central America | 0.0 /100 | #325 | Tragic $34,974 |
| Immigrants | Cuba | 0.0 /100 | #326 | Tragic $34,910 |
| Apache | 0.0 /100 | #327 | Tragic $34,886 |
| Menominee | 0.0 /100 | #328 | Tragic $34,578 |
| Mexicans | 0.0 /100 | #329 | Tragic $34,559 |
| Spanish American Indians | 0.0 /100 | #330 | Tragic $34,195 |
| Immigrants | Mexico | 0.0 /100 | #331 | Tragic $33,931 |
| Sioux | 0.0 /100 | #332 | Tragic $33,921 |
| Immigrants | Yemen | 0.0 /100 | #333 | Tragic $33,696 |
| Natives/Alaskans | 0.0 /100 | #334 | Tragic $33,279 |
| Yuman | 0.0 /100 | #335 | Tragic $33,236 |
| Yakama | 0.0 /100 | #336 | Tragic $33,009 |
| Houma | 0.0 /100 | #337 | Tragic $32,996 |