Armenian vs Immigrants from India Householder Income Ages 25 - 44 years
COMPARE
Armenian
Immigrants from India
Householder Income Ages 25 - 44 years
Householder Income Ages 25 - 44 years Comparison
Armenians
Immigrants from India
$103,248
HOUSEHOLDER INCOME AGES 25 - 44 YEARS
99.2/ 100
METRIC RATING
79th/ 347
METRIC RANK
$124,238
HOUSEHOLDER INCOME AGES 25 - 44 YEARS
100.0/ 100
METRIC RATING
5th/ 347
METRIC RANK
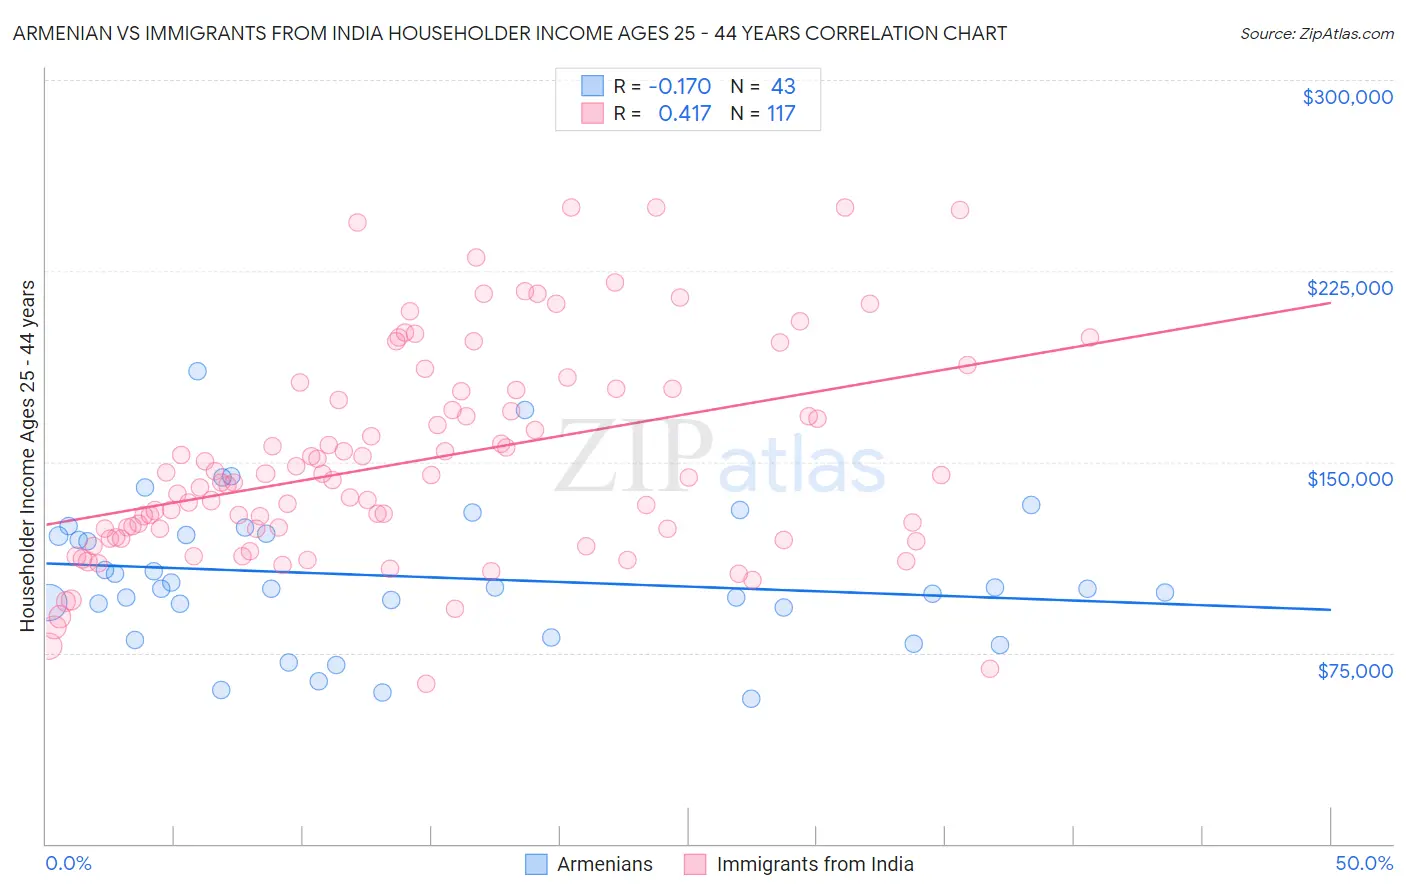
Armenian vs Immigrants from India Householder Income Ages 25 - 44 years Correlation Chart
The statistical analysis conducted on geographies consisting of 310,247,429 people shows a poor negative correlation between the proportion of Armenians and household income with householder between the ages 25 and 44 in the United States with a correlation coefficient (R) of -0.170 and weighted average of $103,248. Similarly, the statistical analysis conducted on geographies consisting of 432,826,792 people shows a moderate positive correlation between the proportion of Immigrants from India and household income with householder between the ages 25 and 44 in the United States with a correlation coefficient (R) of 0.417 and weighted average of $124,238, a difference of 20.3%.
Householder Income Ages 25 - 44 years Correlation Summary
| Measurement | Armenian | Immigrants from India |
| Minimum | $56,917 | $63,072 |
| Maximum | $185,535 | $250,001 |
| Range | $128,618 | $186,929 |
| Mean | $105,016 | $150,115 |
| Median | $100,154 | $143,110 |
| Interquartile 25% (IQ1) | $92,917 | $120,254 |
| Interquartile 75% (IQ3) | $121,535 | $177,993 |
| Interquartile Range (IQR) | $28,618 | $57,739 |
| Standard Deviation (Sample) | $28,063 | $41,287 |
| Standard Deviation (Population) | $27,735 | $41,110 |
Similar Demographics by Householder Income Ages 25 - 44 years
Demographics Similar to Armenians by Householder Income Ages 25 - 44 years
In terms of householder income ages 25 - 44 years, the demographic groups most similar to Armenians are Immigrants from Egypt ($103,192, a difference of 0.050%), South African ($103,160, a difference of 0.080%), Immigrants from Serbia ($103,155, a difference of 0.090%), Argentinean ($103,111, a difference of 0.13%), and Immigrants from Bulgaria ($103,423, a difference of 0.17%).
| Demographics | Rating | Rank | Householder Income Ages 25 - 44 years |
| Chinese | 99.5 /100 | #72 | Exceptional $104,264 |
| Italians | 99.5 /100 | #73 | Exceptional $104,215 |
| Immigrants | Fiji | 99.5 /100 | #74 | Exceptional $103,954 |
| Koreans | 99.4 /100 | #75 | Exceptional $103,824 |
| Immigrants | Spain | 99.4 /100 | #76 | Exceptional $103,752 |
| Immigrants | Southern Europe | 99.3 /100 | #77 | Exceptional $103,486 |
| Immigrants | Bulgaria | 99.3 /100 | #78 | Exceptional $103,423 |
| Armenians | 99.2 /100 | #79 | Exceptional $103,248 |
| Immigrants | Egypt | 99.2 /100 | #80 | Exceptional $103,192 |
| South Africans | 99.2 /100 | #81 | Exceptional $103,160 |
| Immigrants | Serbia | 99.2 /100 | #82 | Exceptional $103,155 |
| Argentineans | 99.1 /100 | #83 | Exceptional $103,111 |
| Immigrants | Philippines | 99.0 /100 | #84 | Exceptional $102,910 |
| Immigrants | Ukraine | 98.9 /100 | #85 | Exceptional $102,664 |
| Immigrants | Hungary | 98.9 /100 | #86 | Exceptional $102,655 |
Demographics Similar to Immigrants from India by Householder Income Ages 25 - 44 years
In terms of householder income ages 25 - 44 years, the demographic groups most similar to Immigrants from India are Immigrants from Singapore ($124,429, a difference of 0.15%), Thai ($121,778, a difference of 2.0%), Immigrants from Hong Kong ($128,140, a difference of 3.1%), Immigrants from Ireland ($120,333, a difference of 3.3%), and Iranian ($120,292, a difference of 3.3%).
| Demographics | Rating | Rank | Householder Income Ages 25 - 44 years |
| Immigrants | Taiwan | 100.0 /100 | #1 | Exceptional $129,122 |
| Filipinos | 100.0 /100 | #2 | Exceptional $128,723 |
| Immigrants | Hong Kong | 100.0 /100 | #3 | Exceptional $128,140 |
| Immigrants | Singapore | 100.0 /100 | #4 | Exceptional $124,429 |
| Immigrants | India | 100.0 /100 | #5 | Exceptional $124,238 |
| Thais | 100.0 /100 | #6 | Exceptional $121,778 |
| Immigrants | Ireland | 100.0 /100 | #7 | Exceptional $120,333 |
| Iranians | 100.0 /100 | #8 | Exceptional $120,292 |
| Immigrants | China | 100.0 /100 | #9 | Exceptional $119,756 |
| Indians (Asian) | 100.0 /100 | #10 | Exceptional $119,496 |
| Okinawans | 100.0 /100 | #11 | Exceptional $119,349 |
| Immigrants | Iran | 100.0 /100 | #12 | Exceptional $119,204 |
| Immigrants | Eastern Asia | 100.0 /100 | #13 | Exceptional $118,056 |
| Immigrants | Israel | 100.0 /100 | #14 | Exceptional $117,219 |
| Immigrants | South Central Asia | 100.0 /100 | #15 | Exceptional $116,626 |