Immigrants from El Salvador vs Immigrants from India Householder Income Ages 25 - 44 years
COMPARE
Immigrants from El Salvador
Immigrants from India
Householder Income Ages 25 - 44 years
Householder Income Ages 25 - 44 years Comparison
Immigrants from El Salvador
Immigrants from India
$86,913
HOUSEHOLDER INCOME AGES 25 - 44 YEARS
1.4/ 100
METRIC RATING
245th/ 347
METRIC RANK
$124,238
HOUSEHOLDER INCOME AGES 25 - 44 YEARS
100.0/ 100
METRIC RATING
5th/ 347
METRIC RANK
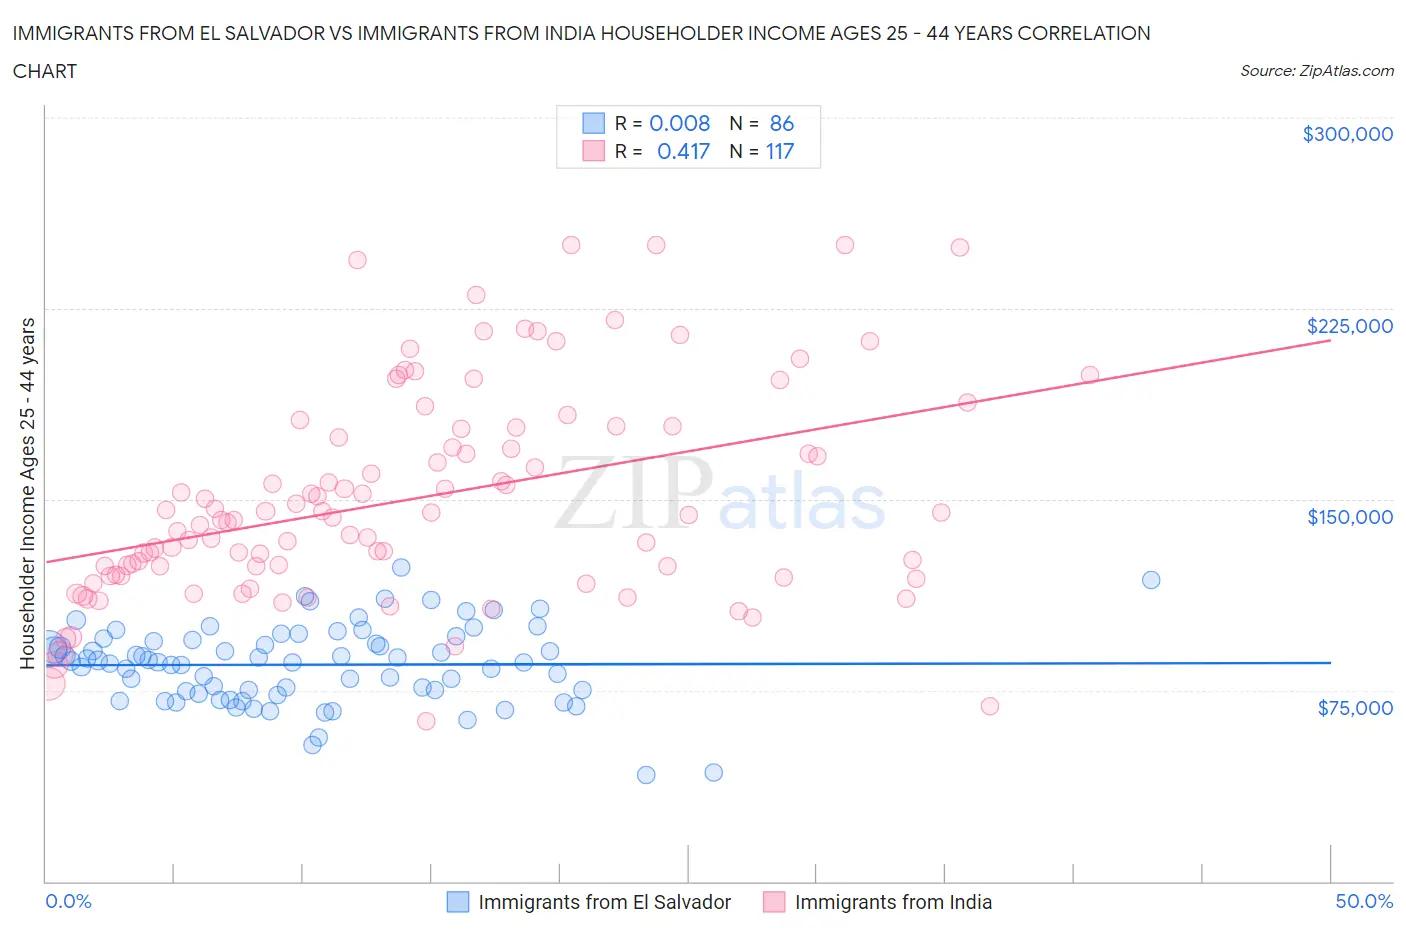
Immigrants from El Salvador vs Immigrants from India Householder Income Ages 25 - 44 years Correlation Chart
The statistical analysis conducted on geographies consisting of 357,268,727 people shows no correlation between the proportion of Immigrants from El Salvador and household income with householder between the ages 25 and 44 in the United States with a correlation coefficient (R) of 0.008 and weighted average of $86,913. Similarly, the statistical analysis conducted on geographies consisting of 432,826,792 people shows a moderate positive correlation between the proportion of Immigrants from India and household income with householder between the ages 25 and 44 in the United States with a correlation coefficient (R) of 0.417 and weighted average of $124,238, a difference of 42.9%.
Householder Income Ages 25 - 44 years Correlation Summary
| Measurement | Immigrants from El Salvador | Immigrants from India |
| Minimum | $41,962 | $63,072 |
| Maximum | $123,232 | $250,001 |
| Range | $81,270 | $186,929 |
| Mean | $85,059 | $150,115 |
| Median | $86,368 | $143,110 |
| Interquartile 25% (IQ1) | $74,423 | $120,254 |
| Interquartile 75% (IQ3) | $94,628 | $177,993 |
| Interquartile Range (IQR) | $20,205 | $57,739 |
| Standard Deviation (Sample) | $15,431 | $41,287 |
| Standard Deviation (Population) | $15,341 | $41,110 |
Similar Demographics by Householder Income Ages 25 - 44 years
Demographics Similar to Immigrants from El Salvador by Householder Income Ages 25 - 44 years
In terms of householder income ages 25 - 44 years, the demographic groups most similar to Immigrants from El Salvador are Immigrants from Venezuela ($87,038, a difference of 0.14%), Immigrants from West Indies ($87,063, a difference of 0.17%), Immigrants from Burma/Myanmar ($86,736, a difference of 0.20%), West Indian ($87,205, a difference of 0.34%), and Immigrants from Nigeria ($86,589, a difference of 0.37%).
| Demographics | Rating | Rank | Householder Income Ages 25 - 44 years |
| Alaska Natives | 2.6 /100 | #238 | Tragic $88,018 |
| Immigrants | Ghana | 2.2 /100 | #239 | Tragic $87,760 |
| Nicaraguans | 2.2 /100 | #240 | Tragic $87,751 |
| Nigerians | 2.2 /100 | #241 | Tragic $87,730 |
| West Indians | 1.7 /100 | #242 | Tragic $87,205 |
| Immigrants | West Indies | 1.5 /100 | #243 | Tragic $87,063 |
| Immigrants | Venezuela | 1.5 /100 | #244 | Tragic $87,038 |
| Immigrants | El Salvador | 1.4 /100 | #245 | Tragic $86,913 |
| Immigrants | Burma/Myanmar | 1.3 /100 | #246 | Tragic $86,736 |
| Immigrants | Nigeria | 1.2 /100 | #247 | Tragic $86,589 |
| Immigrants | Sudan | 0.9 /100 | #248 | Tragic $86,109 |
| French American Indians | 0.8 /100 | #249 | Tragic $85,899 |
| Pennsylvania Germans | 0.8 /100 | #250 | Tragic $85,836 |
| Cape Verdeans | 0.8 /100 | #251 | Tragic $85,758 |
| Immigrants | Western Africa | 0.7 /100 | #252 | Tragic $85,676 |
Demographics Similar to Immigrants from India by Householder Income Ages 25 - 44 years
In terms of householder income ages 25 - 44 years, the demographic groups most similar to Immigrants from India are Immigrants from Singapore ($124,429, a difference of 0.15%), Thai ($121,778, a difference of 2.0%), Immigrants from Hong Kong ($128,140, a difference of 3.1%), Immigrants from Ireland ($120,333, a difference of 3.3%), and Iranian ($120,292, a difference of 3.3%).
| Demographics | Rating | Rank | Householder Income Ages 25 - 44 years |
| Immigrants | Taiwan | 100.0 /100 | #1 | Exceptional $129,122 |
| Filipinos | 100.0 /100 | #2 | Exceptional $128,723 |
| Immigrants | Hong Kong | 100.0 /100 | #3 | Exceptional $128,140 |
| Immigrants | Singapore | 100.0 /100 | #4 | Exceptional $124,429 |
| Immigrants | India | 100.0 /100 | #5 | Exceptional $124,238 |
| Thais | 100.0 /100 | #6 | Exceptional $121,778 |
| Immigrants | Ireland | 100.0 /100 | #7 | Exceptional $120,333 |
| Iranians | 100.0 /100 | #8 | Exceptional $120,292 |
| Immigrants | China | 100.0 /100 | #9 | Exceptional $119,756 |
| Indians (Asian) | 100.0 /100 | #10 | Exceptional $119,496 |
| Okinawans | 100.0 /100 | #11 | Exceptional $119,349 |
| Immigrants | Iran | 100.0 /100 | #12 | Exceptional $119,204 |
| Immigrants | Eastern Asia | 100.0 /100 | #13 | Exceptional $118,056 |
| Immigrants | Israel | 100.0 /100 | #14 | Exceptional $117,219 |
| Immigrants | South Central Asia | 100.0 /100 | #15 | Exceptional $116,626 |