Armenian vs Polish Householder Income Ages 25 - 44 years
COMPARE
Armenian
Polish
Householder Income Ages 25 - 44 years
Householder Income Ages 25 - 44 years Comparison
Armenians
Poles
$103,248
HOUSEHOLDER INCOME AGES 25 - 44 YEARS
99.2/ 100
METRIC RATING
79th/ 347
METRIC RANK
$99,685
HOUSEHOLDER INCOME AGES 25 - 44 YEARS
94.5/ 100
METRIC RATING
112th/ 347
METRIC RANK
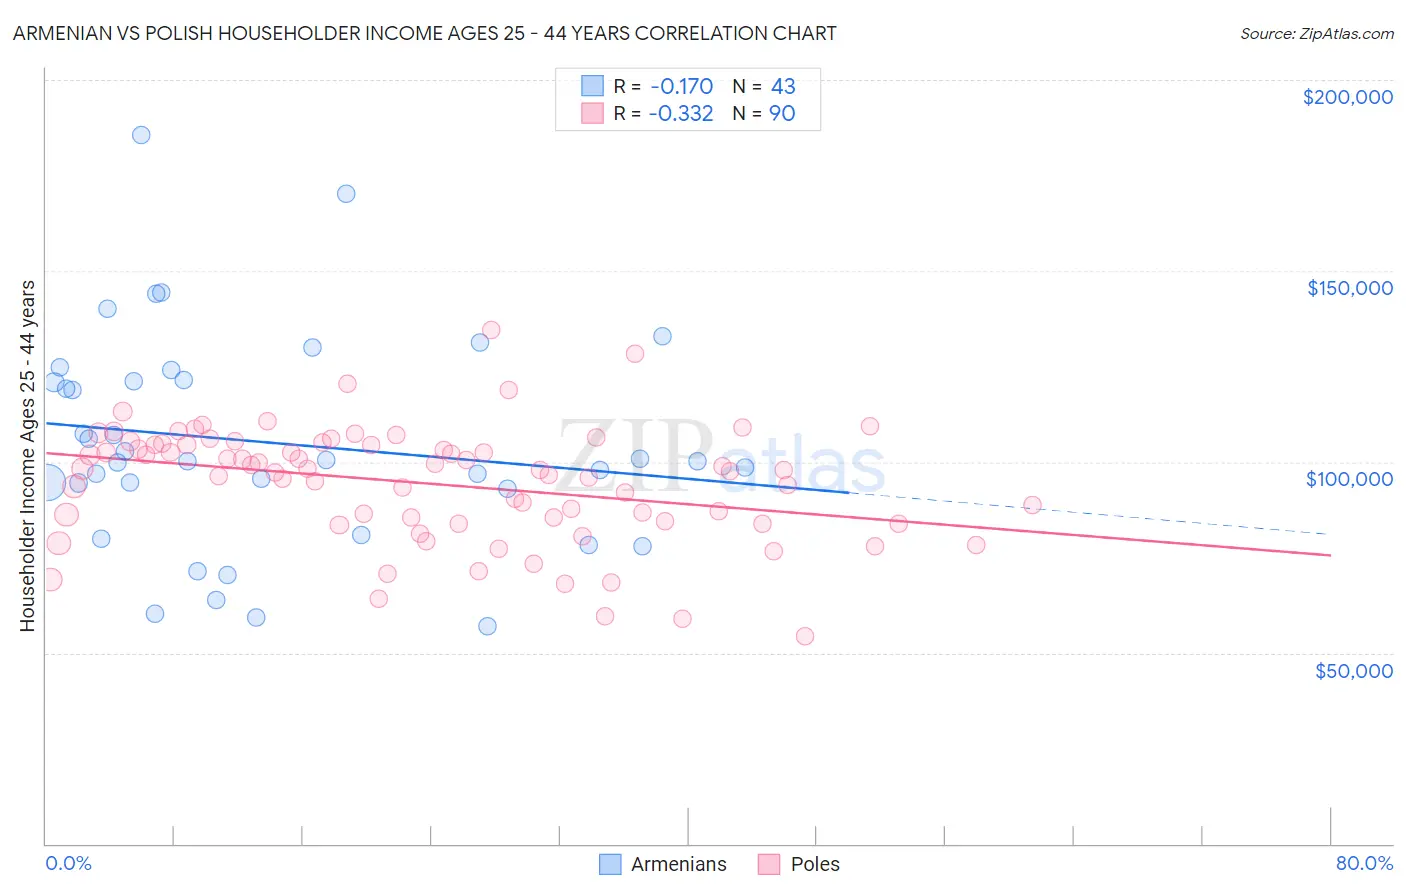
Armenian vs Polish Householder Income Ages 25 - 44 years Correlation Chart
The statistical analysis conducted on geographies consisting of 310,247,429 people shows a poor negative correlation between the proportion of Armenians and household income with householder between the ages 25 and 44 in the United States with a correlation coefficient (R) of -0.170 and weighted average of $103,248. Similarly, the statistical analysis conducted on geographies consisting of 555,649,021 people shows a mild negative correlation between the proportion of Poles and household income with householder between the ages 25 and 44 in the United States with a correlation coefficient (R) of -0.332 and weighted average of $99,685, a difference of 3.6%.
Householder Income Ages 25 - 44 years Correlation Summary
| Measurement | Armenian | Polish |
| Minimum | $56,917 | $54,279 |
| Maximum | $185,535 | $134,668 |
| Range | $128,618 | $80,389 |
| Mean | $105,016 | $94,388 |
| Median | $100,154 | $97,963 |
| Interquartile 25% (IQ1) | $92,917 | $84,559 |
| Interquartile 75% (IQ3) | $121,535 | $104,554 |
| Interquartile Range (IQR) | $28,618 | $19,995 |
| Standard Deviation (Sample) | $28,063 | $15,033 |
| Standard Deviation (Population) | $27,735 | $14,949 |
Similar Demographics by Householder Income Ages 25 - 44 years
Demographics Similar to Armenians by Householder Income Ages 25 - 44 years
In terms of householder income ages 25 - 44 years, the demographic groups most similar to Armenians are Immigrants from Egypt ($103,192, a difference of 0.050%), South African ($103,160, a difference of 0.080%), Immigrants from Serbia ($103,155, a difference of 0.090%), Argentinean ($103,111, a difference of 0.13%), and Immigrants from Bulgaria ($103,423, a difference of 0.17%).
| Demographics | Rating | Rank | Householder Income Ages 25 - 44 years |
| Chinese | 99.5 /100 | #72 | Exceptional $104,264 |
| Italians | 99.5 /100 | #73 | Exceptional $104,215 |
| Immigrants | Fiji | 99.5 /100 | #74 | Exceptional $103,954 |
| Koreans | 99.4 /100 | #75 | Exceptional $103,824 |
| Immigrants | Spain | 99.4 /100 | #76 | Exceptional $103,752 |
| Immigrants | Southern Europe | 99.3 /100 | #77 | Exceptional $103,486 |
| Immigrants | Bulgaria | 99.3 /100 | #78 | Exceptional $103,423 |
| Armenians | 99.2 /100 | #79 | Exceptional $103,248 |
| Immigrants | Egypt | 99.2 /100 | #80 | Exceptional $103,192 |
| South Africans | 99.2 /100 | #81 | Exceptional $103,160 |
| Immigrants | Serbia | 99.2 /100 | #82 | Exceptional $103,155 |
| Argentineans | 99.1 /100 | #83 | Exceptional $103,111 |
| Immigrants | Philippines | 99.0 /100 | #84 | Exceptional $102,910 |
| Immigrants | Ukraine | 98.9 /100 | #85 | Exceptional $102,664 |
| Immigrants | Hungary | 98.9 /100 | #86 | Exceptional $102,655 |
Demographics Similar to Poles by Householder Income Ages 25 - 44 years
In terms of householder income ages 25 - 44 years, the demographic groups most similar to Poles are Tongan ($99,604, a difference of 0.080%), Immigrants from Western Asia ($99,516, a difference of 0.17%), Chilean ($99,900, a difference of 0.22%), Carpatho Rusyn ($99,449, a difference of 0.24%), and Portuguese ($99,429, a difference of 0.26%).
| Demographics | Rating | Rank | Householder Income Ages 25 - 44 years |
| Immigrants | Vietnam | 96.5 /100 | #105 | Exceptional $100,535 |
| Immigrants | Brazil | 96.5 /100 | #106 | Exceptional $100,534 |
| Northern Europeans | 96.3 /100 | #107 | Exceptional $100,457 |
| Immigrants | South Eastern Asia | 96.0 /100 | #108 | Exceptional $100,283 |
| Immigrants | North Macedonia | 95.6 /100 | #109 | Exceptional $100,101 |
| Immigrants | Afghanistan | 95.3 /100 | #110 | Exceptional $99,977 |
| Chileans | 95.1 /100 | #111 | Exceptional $99,900 |
| Poles | 94.5 /100 | #112 | Exceptional $99,685 |
| Tongans | 94.2 /100 | #113 | Exceptional $99,604 |
| Immigrants | Western Asia | 94.0 /100 | #114 | Exceptional $99,516 |
| Carpatho Rusyns | 93.7 /100 | #115 | Exceptional $99,449 |
| Portuguese | 93.7 /100 | #116 | Exceptional $99,429 |
| Immigrants | Northern Africa | 93.0 /100 | #117 | Exceptional $99,232 |
| Syrians | 92.9 /100 | #118 | Exceptional $99,215 |
| Jordanians | 92.8 /100 | #119 | Exceptional $99,186 |