Armenian vs Immigrants from Italy Householder Income Ages 25 - 44 years

COMPARE

Armenian
Race
Ancestry
AfghanAfricanAlaska NativeAlaskan AthabascanAlbanianAleutAlsatianAmericanApacheArabArapahoArgentineanArmenianAssyrian/Chaldean/SyriacAustralianAustrianBahamianBangladeshiBarbadianBasqueBelgianBelizeanBermudanBhutaneseBlackfeetBolivianBrazilianBritishBritish West IndianBulgarianBurmeseCajunCambodianCanadianCape VerdeanCarpatho RusynCelticCentral AmericanCentral American IndianCherokeeCheyenneChickasawChileanChineseChippewaChoctawColombianColvilleComancheCosta RicanCreeCreekCroatianCrowCubanCypriotCzechCzechoslovakianDanishDelawareDominicanDutchDutch West IndianEastern EuropeanEcuadorianEgyptianEnglishEstonianEthiopianEuropeanFijianFilipinoFinnishFrenchFrench American IndianFrench CanadianGermanGerman RussianGhanaianGreekGuamanian/ChamorroGuatemalanGuyaneseHaitianHmongHonduranHopiHoumaHungarianIcelanderIndian (Asian)IndonesianInupiatIranianIraqiIrishIroquoisIsraeliItalianJamaicanJapaneseJordanianKenyanKiowaKoreanLaotianLatvianLebaneseLiberianLithuanianLumbeeLuxembourgerMacedonianMalaysianMalteseMarshalleseMenomineeMexicanMexican American IndianMongolianMoroccanNative HawaiianNavajoNepaleseNew ZealanderNicaraguanNigerianNorthern EuropeanNorwegianOkinawanOsageOttawaPaiutePakistaniPalestinianPanamanianParaguayanPennsylvania GermanPeruvianPimaPolishPortuguesePotawatomiPuebloPuerto RicanPuget Sound SalishRomanianRussianSalvadoranSamoanScandinavianScotch-IrishScottishSeminoleSenegaleseSerbianShoshoneSierra LeoneanSiouxSlavicSlovakSloveneSomaliSouth AfricanSouth AmericanSouth American IndianSoviet UnionSpaniardSpanishSpanish AmericanSpanish American IndianSri LankanSubsaharan AfricanSudaneseSwedishSwissSyrianTaiwaneseThaiTlingit-HaidaTohono O'OdhamTonganTrinidadian and TobagonianTsimshianTurkishU.S. Virgin IslanderUgandanUkrainianUruguayanUteVenezuelanVietnameseWelshWest IndianYakamaYaquiYugoslavianYumanYup'ikZimbabwean
Immigration
NonimmigrantsImmigrantsAfghanistanAfricaAlbaniaArgentinaArmeniaAsiaAustraliaAustriaBahamasBangladeshBarbadosBelarusBelgiumBelizeBoliviaBosnia and HerzegovinaBrazilBulgariaBurma/MyanmarCabo VerdeCambodiaCameroonCanadaCaribbeanCentral AmericaChileChinaColombiaCongoCosta RicaCroatiaCubaCzechoslovakiaDenmarkDominicaDominican RepublicEastern AfricaEastern AsiaEastern EuropeEcuadorEgyptEl SalvadorEnglandEritreaEthiopiaEuropeFijiFranceGermanyGhanaGreeceGrenadaGuatemalaGuyanaHaitiHondurasHong KongHungaryIndiaIndonesiaIranIraqIrelandIsraelJamaicaJapanJordanKazakhstanKenyaKoreaKuwaitLaosLatin AmericaLatviaLebanonLiberiaLithuaniaMalaysiaMexicoMicronesiaMiddle AfricaMoldovaMoroccoNepalNetherlandsNicaraguaNigeriaNorth AmericaNorth MacedoniaNorthern AfricaNorthern EuropeNorwayOceaniaPakistanPanamaPeruPhilippinesPolandPortugalRomaniaRussiaSaudi ArabiaScotlandSenegalSerbiaSierra LeoneSingaporeSomaliaSouth AfricaSouth AmericaSouth Central AsiaSouth Eastern AsiaSouthern EuropeSpainSri LankaSt. Vincent and the GrenadinesSudanSwedenSwitzerlandSyriaTaiwanThailandTrinidad and TobagoTurkeyUgandaUkraineUruguayUzbekistanVenezuelaVietnamWest IndiesWestern AfricaWestern AsiaWestern EuropeYemenZaireZimbabweAzores
Immigrants from Italy
Race
Ancestry
AfghanAfricanAlaska NativeAlaskan AthabascanAlbanianAleutAlsatianAmericanApacheArabArapahoArgentineanAssyrian/Chaldean/SyriacAustralianAustrianBahamianBangladeshiBarbadianBasqueBelgianBelizeanBermudanBhutaneseBlackfeetBolivianBrazilianBritishBritish West IndianBulgarianBurmeseCajunCambodianCanadianCape VerdeanCarpatho RusynCelticCentral AmericanCentral American IndianCherokeeCheyenneChickasawChileanChineseChippewaChoctawColombianColvilleComancheCosta RicanCreeCreekCroatianCrowCubanCypriotCzechCzechoslovakianDanishDelawareDominicanDutchDutch West IndianEastern EuropeanEcuadorianEgyptianEnglishEstonianEthiopianEuropeanFijianFilipinoFinnishFrenchFrench American IndianFrench CanadianGermanGerman RussianGhanaianGreekGuamanian/ChamorroGuatemalanGuyaneseHaitianHmongHonduranHopiHoumaHungarianIcelanderIndian (Asian)IndonesianInupiatIranianIraqiIrishIroquoisIsraeliItalianJamaicanJapaneseJordanianKenyanKiowaKoreanLaotianLatvianLebaneseLiberianLithuanianLumbeeLuxembourgerMacedonianMalaysianMalteseMarshalleseMenomineeMexicanMexican American IndianMongolianMoroccanNative HawaiianNavajoNepaleseNew ZealanderNicaraguanNigerianNorthern EuropeanNorwegianOkinawanOsageOttawaPaiutePakistaniPalestinianPanamanianParaguayanPennsylvania GermanPeruvianPimaPolishPortuguesePotawatomiPuebloPuerto RicanPuget Sound SalishRomanianRussianSalvadoranSamoanScandinavianScotch-IrishScottishSeminoleSenegaleseSerbianShoshoneSierra LeoneanSiouxSlavicSlovakSloveneSomaliSouth AfricanSouth AmericanSouth American IndianSoviet UnionSpaniardSpanishSpanish AmericanSpanish American IndianSri LankanSubsaharan AfricanSudaneseSwedishSwissSyrianTaiwaneseThaiTlingit-HaidaTohono O'OdhamTonganTrinidadian and TobagonianTsimshianTurkishU.S. Virgin IslanderUgandanUkrainianUruguayanUteVenezuelanVietnameseWelshWest IndianYakamaYaquiYugoslavianYumanYup'ikZimbabwean
Immigration
NonimmigrantsImmigrantsAfghanistanAfricaAlbaniaArgentinaArmeniaAsiaAustraliaAustriaBahamasBangladeshBarbadosBelarusBelgiumBelizeBoliviaBosnia and HerzegovinaBrazilBulgariaBurma/MyanmarCabo VerdeCambodiaCameroonCanadaCaribbeanCentral AmericaChileChinaColombiaCongoCosta RicaCroatiaCubaCzechoslovakiaDenmarkDominicaDominican RepublicEastern AfricaEastern AsiaEastern EuropeEcuadorEgyptEl SalvadorEnglandEritreaEthiopiaEuropeFijiFranceGermanyGhanaGreeceGrenadaGuatemalaGuyanaHaitiHondurasHong KongHungaryIndiaIndonesiaIranIraqIrelandIsraelItalyJamaicaJapanJordanKazakhstanKenyaKoreaKuwaitLaosLatin AmericaLatviaLebanonLiberiaLithuaniaMalaysiaMexicoMicronesiaMiddle AfricaMoldovaMoroccoNepalNetherlandsNicaraguaNigeriaNorth AmericaNorth MacedoniaNorthern AfricaNorthern EuropeNorwayOceaniaPakistanPanamaPeruPhilippinesPolandPortugalRomaniaRussiaSaudi ArabiaScotlandSenegalSerbiaSierra LeoneSingaporeSomaliaSouth AfricaSouth AmericaSouth Central AsiaSouth Eastern AsiaSouthern EuropeSpainSri LankaSt. Vincent and the GrenadinesSudanSwedenSwitzerlandSyriaTaiwanThailandTrinidad and TobagoTurkeyUgandaUkraineUruguayUzbekistanVenezuelaVietnamWest IndiesWestern AfricaWestern AsiaWestern EuropeYemenZaireZimbabweAzores
Householder Income Ages 25 - 44 years
Income
Poverty
Unemployment
Labor Participation
Family Structure
Vehicle Availability
Education Level
Disability

Householder Income Ages 25 - 44 years Comparison

Armenians

Immigrants from Italy

Exceptional
Exceptional
$103,248
HOUSEHOLDER INCOME AGES 25 - 44 YEARS
99.2/ 100
METRIC RATING
79th/ 347
METRIC RANK
$105,201
HOUSEHOLDER INCOME AGES 25 - 44 YEARS
99.7/ 100
METRIC RATING
62nd/ 347
METRIC RANK

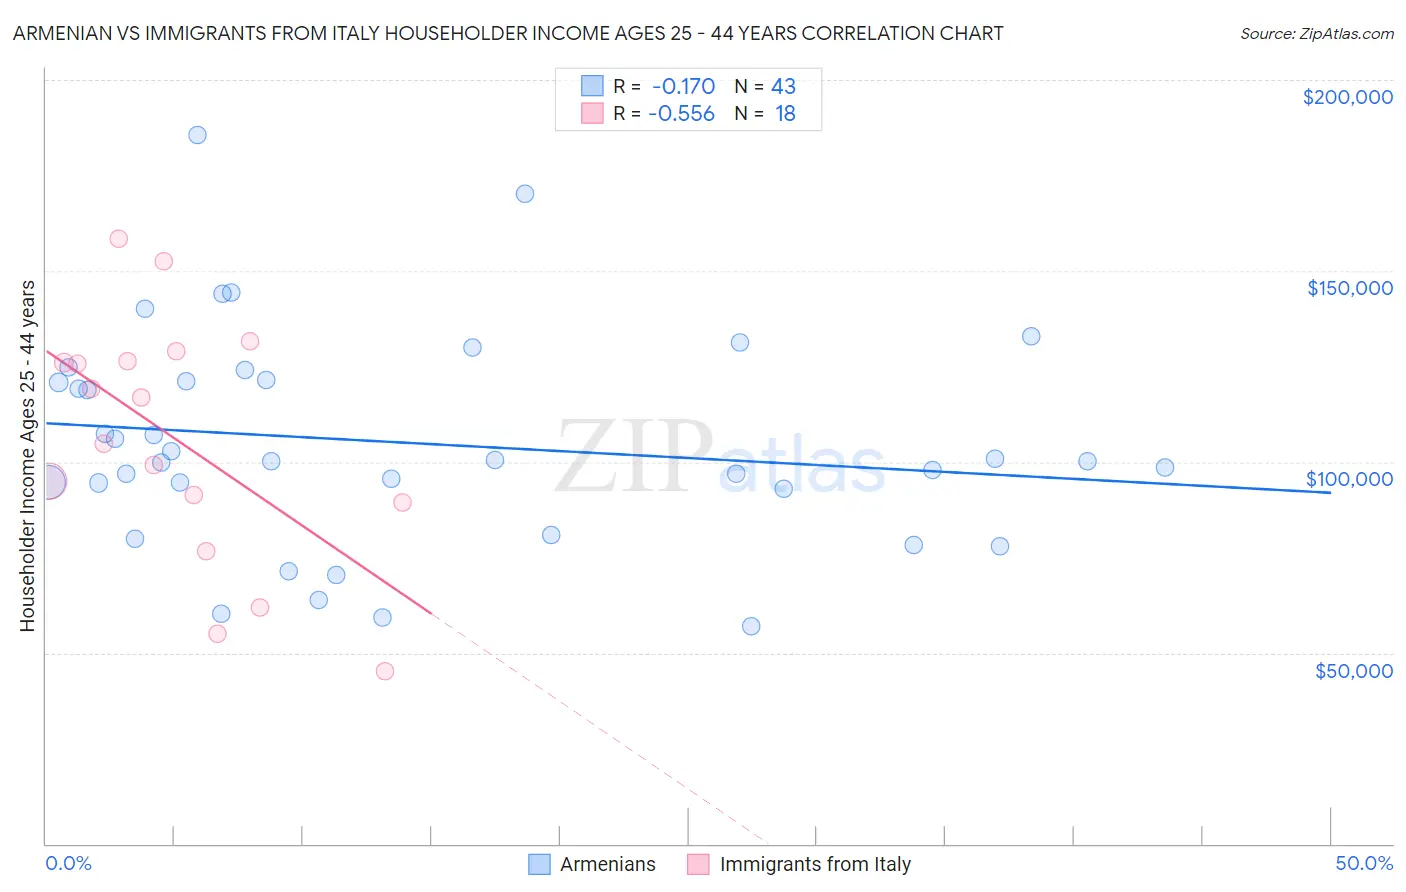
Armenian vs Immigrants from Italy Householder Income Ages 25 - 44 years Correlation Chart

The statistical analysis conducted on geographies consisting of 310,247,429 people shows a poor negative correlation between the proportion of Armenians and household income with householder between the ages 25 and 44 in the United States with a correlation coefficient (R) of -0.170 and weighted average of $103,248. Similarly, the statistical analysis conducted on geographies consisting of 323,420,404 people shows a substantial negative correlation between the proportion of Immigrants from Italy and household income with householder between the ages 25 and 44 in the United States with a correlation coefficient (R) of -0.556 and weighted average of $105,201, a difference of 1.9%.
Armenian vs Immigrants from Italy Householder Income Ages 25 - 44 years

Householder Income Ages 25 - 44 years Correlation Summary

MeasurementArmenianImmigrants from Italy
Minimum$56,917$45,256
Maximum$185,535$158,531
Range$128,618$113,275
Mean$105,016$105,762
Median$100,154$110,729
Interquartile 25% (IQ1)$92,917$89,375
Interquartile 75% (IQ3)$121,535$126,307
Interquartile Range (IQR)$28,618$36,932
Standard Deviation (Sample)$28,063$31,956
Standard Deviation (Population)$27,735$31,055

Demographics Similar to Armenians and Immigrants from Italy by Householder Income Ages 25 - 44 years

In terms of householder income ages 25 - 44 years, the demographic groups most similar to Armenians are Immigrants from Egypt ($103,192, a difference of 0.050%), Immigrants from Bulgaria ($103,423, a difference of 0.17%), Immigrants from Southern Europe ($103,486, a difference of 0.23%), Immigrants from Spain ($103,752, a difference of 0.49%), and Korean ($103,824, a difference of 0.56%). Similarly, the demographic groups most similar to Immigrants from Italy are Lithuanian ($105,223, a difference of 0.020%), Egyptian ($105,282, a difference of 0.080%), Immigrants from Scotland ($105,089, a difference of 0.11%), New Zealander ($105,085, a difference of 0.11%), and Immigrants from Netherlands ($105,082, a difference of 0.11%).
DemographicsRating | RankHouseholder Income Ages 25 - 44 years
Egyptians
99.7
/100
|
#60
Exceptional
$105,282
Lithuanians
99.7
/100
|
#61
Exceptional
$105,223
Immigrants | Italy
99.7
/100
|
#62
Exceptional
$105,201
Immigrants | Scotland
99.7
/100
|
#63
Exceptional
$105,089
New Zealanders
99.7
/100
|
#64
Exceptional
$105,085
Immigrants | Netherlands
99.7
/100
|
#65
Exceptional
$105,082
Laotians
99.7
/100
|
#66
Exceptional
$104,993
Immigrants | Romania
99.6
/100
|
#67
Exceptional
$104,713
Immigrants | Eastern Europe
99.6
/100
|
#68
Exceptional
$104,662
Mongolians
99.6
/100
|
#69
Exceptional
$104,578
Immigrants | Croatia
99.6
/100
|
#70
Exceptional
$104,503
Afghans
99.6
/100
|
#71
Exceptional
$104,410
Chinese
99.5
/100
|
#72
Exceptional
$104,264
Italians
99.5
/100
|
#73
Exceptional
$104,215
Immigrants | Fiji
99.5
/100
|
#74
Exceptional
$103,954
Koreans
99.4
/100
|
#75
Exceptional
$103,824
Immigrants | Spain
99.4
/100
|
#76
Exceptional
$103,752
Immigrants | Southern Europe
99.3
/100
|
#77
Exceptional
$103,486
Immigrants | Bulgaria
99.3
/100
|
#78
Exceptional
$103,423
Armenians
99.2
/100
|
#79
Exceptional
$103,248
Immigrants | Egypt
99.2
/100
|
#80
Exceptional
$103,192