Afghan vs Cheyenne Divorced or Separated
COMPARE
Afghan
Cheyenne
Divorced or Separated
Divorced or Separated Comparison
Afghans
Cheyenne
11.5%
DIVORCED OR SEPARATED
99.4/ 100
METRIC RATING
78th/ 347
METRIC RANK
13.4%
DIVORCED OR SEPARATED
0.0/ 100
METRIC RATING
321st/ 347
METRIC RANK
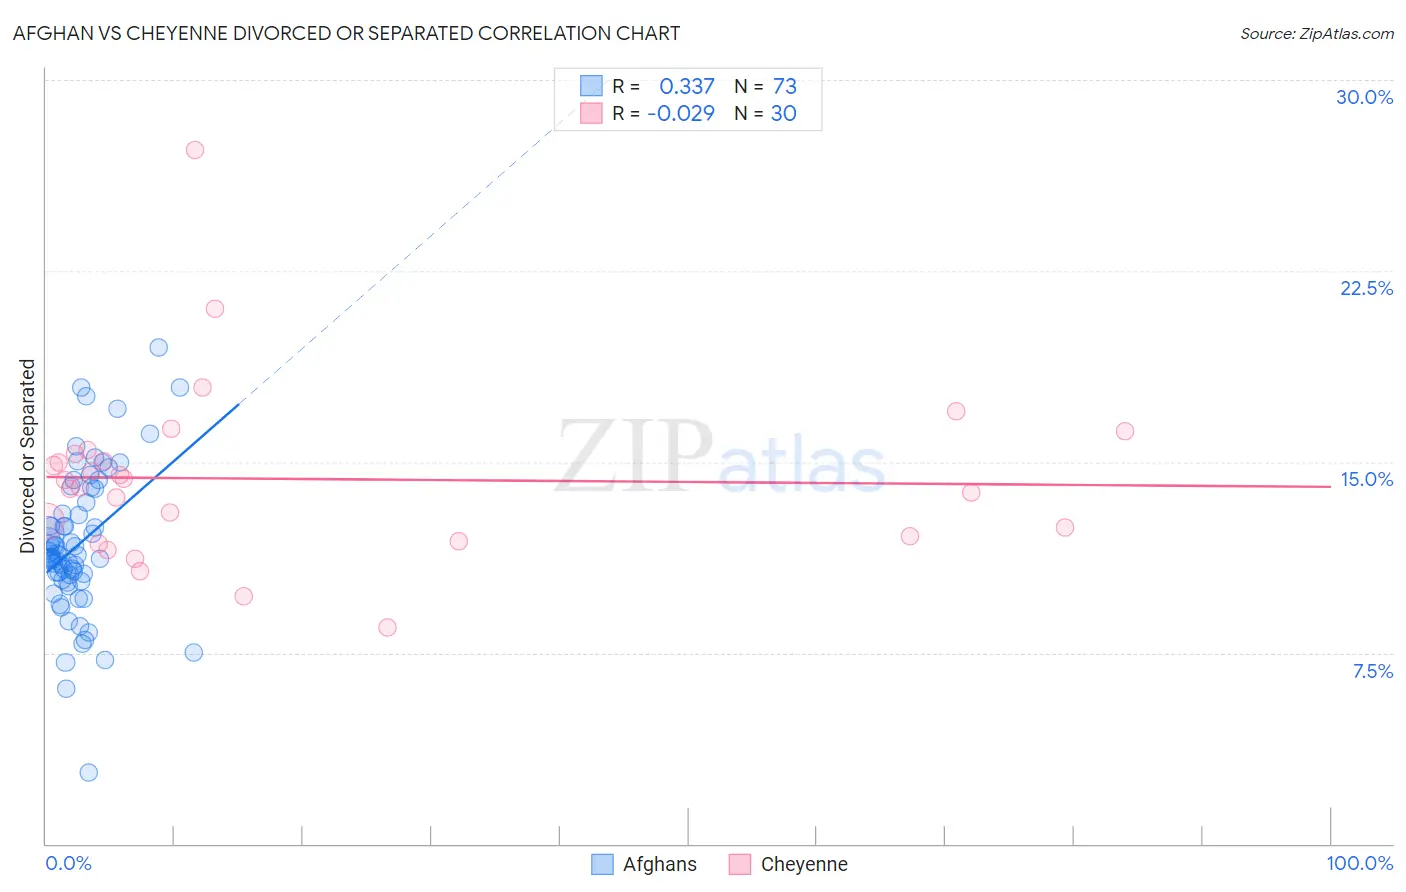
Afghan vs Cheyenne Divorced or Separated Correlation Chart
The statistical analysis conducted on geographies consisting of 148,858,347 people shows a mild positive correlation between the proportion of Afghans and percentage of population currently divorced or separated in the United States with a correlation coefficient (R) of 0.337 and weighted average of 11.5%. Similarly, the statistical analysis conducted on geographies consisting of 80,717,753 people shows no correlation between the proportion of Cheyenne and percentage of population currently divorced or separated in the United States with a correlation coefficient (R) of -0.029 and weighted average of 13.4%, a difference of 16.2%.
Divorced or Separated Correlation Summary
| Measurement | Afghan | Cheyenne |
| Minimum | 2.8% | 8.5% |
| Maximum | 19.5% | 27.2% |
| Range | 16.7% | 18.7% |
| Mean | 11.8% | 14.3% |
| Median | 11.4% | 14.1% |
| Interquartile 25% (IQ1) | 10.3% | 12.1% |
| Interquartile 75% (IQ3) | 13.7% | 15.3% |
| Interquartile Range (IQR) | 3.3% | 3.2% |
| Standard Deviation (Sample) | 2.9% | 3.5% |
| Standard Deviation (Population) | 2.9% | 3.4% |
Similar Demographics by Divorced or Separated
Demographics Similar to Afghans by Divorced or Separated
In terms of divorced or separated, the demographic groups most similar to Afghans are Guyanese (11.5%, a difference of 0.040%), Immigrants from Switzerland (11.5%, a difference of 0.060%), Russian (11.5%, a difference of 0.070%), Immigrants from Italy (11.5%, a difference of 0.10%), and Immigrants from Romania (11.5%, a difference of 0.15%).
| Demographics | Rating | Rank | Divorced or Separated |
| Paraguayans | 99.7 /100 | #71 | Exceptional 11.5% |
| Jordanians | 99.6 /100 | #72 | Exceptional 11.5% |
| Immigrants | North Macedonia | 99.6 /100 | #73 | Exceptional 11.5% |
| Taiwanese | 99.6 /100 | #74 | Exceptional 11.5% |
| Immigrants | Northern Africa | 99.6 /100 | #75 | Exceptional 11.5% |
| Albanians | 99.6 /100 | #76 | Exceptional 11.5% |
| Immigrants | Italy | 99.5 /100 | #77 | Exceptional 11.5% |
| Afghans | 99.4 /100 | #78 | Exceptional 11.5% |
| Guyanese | 99.4 /100 | #79 | Exceptional 11.5% |
| Immigrants | Switzerland | 99.4 /100 | #80 | Exceptional 11.5% |
| Russians | 99.4 /100 | #81 | Exceptional 11.5% |
| Immigrants | Romania | 99.3 /100 | #82 | Exceptional 11.5% |
| Immigrants | Bulgaria | 99.3 /100 | #83 | Exceptional 11.5% |
| Bulgarians | 99.3 /100 | #84 | Exceptional 11.5% |
| Immigrants | Albania | 99.3 /100 | #85 | Exceptional 11.5% |
Demographics Similar to Cheyenne by Divorced or Separated
In terms of divorced or separated, the demographic groups most similar to Cheyenne are Cajun (13.4%, a difference of 0.10%), Puget Sound Salish (13.4%, a difference of 0.16%), Cree (13.4%, a difference of 0.20%), Haitian (13.3%, a difference of 0.22%), and Tsimshian (13.3%, a difference of 0.24%).
| Demographics | Rating | Rank | Divorced or Separated |
| Yaqui | 0.0 /100 | #314 | Tragic 13.3% |
| Spanish Americans | 0.0 /100 | #315 | Tragic 13.3% |
| Tsimshian | 0.0 /100 | #316 | Tragic 13.3% |
| Haitians | 0.0 /100 | #317 | Tragic 13.3% |
| Cree | 0.0 /100 | #318 | Tragic 13.4% |
| Puget Sound Salish | 0.0 /100 | #319 | Tragic 13.4% |
| Cajuns | 0.0 /100 | #320 | Tragic 13.4% |
| Cheyenne | 0.0 /100 | #321 | Tragic 13.4% |
| Immigrants | Haiti | 0.0 /100 | #322 | Tragic 13.4% |
| U.S. Virgin Islanders | 0.0 /100 | #323 | Tragic 13.4% |
| Osage | 0.0 /100 | #324 | Tragic 13.4% |
| Potawatomi | 0.0 /100 | #325 | Tragic 13.5% |
| Immigrants | Congo | 0.0 /100 | #326 | Tragic 13.5% |
| Comanche | 0.0 /100 | #327 | Tragic 13.5% |
| Immigrants | Caribbean | 0.0 /100 | #328 | Tragic 13.6% |