Zip Codes with the Highest Percentage of Population Employed in Manufacturing in Peoria, IL
RELATED REPORTS & OPTIONS
Manufacturing
Peoria
Compare Zip Codes
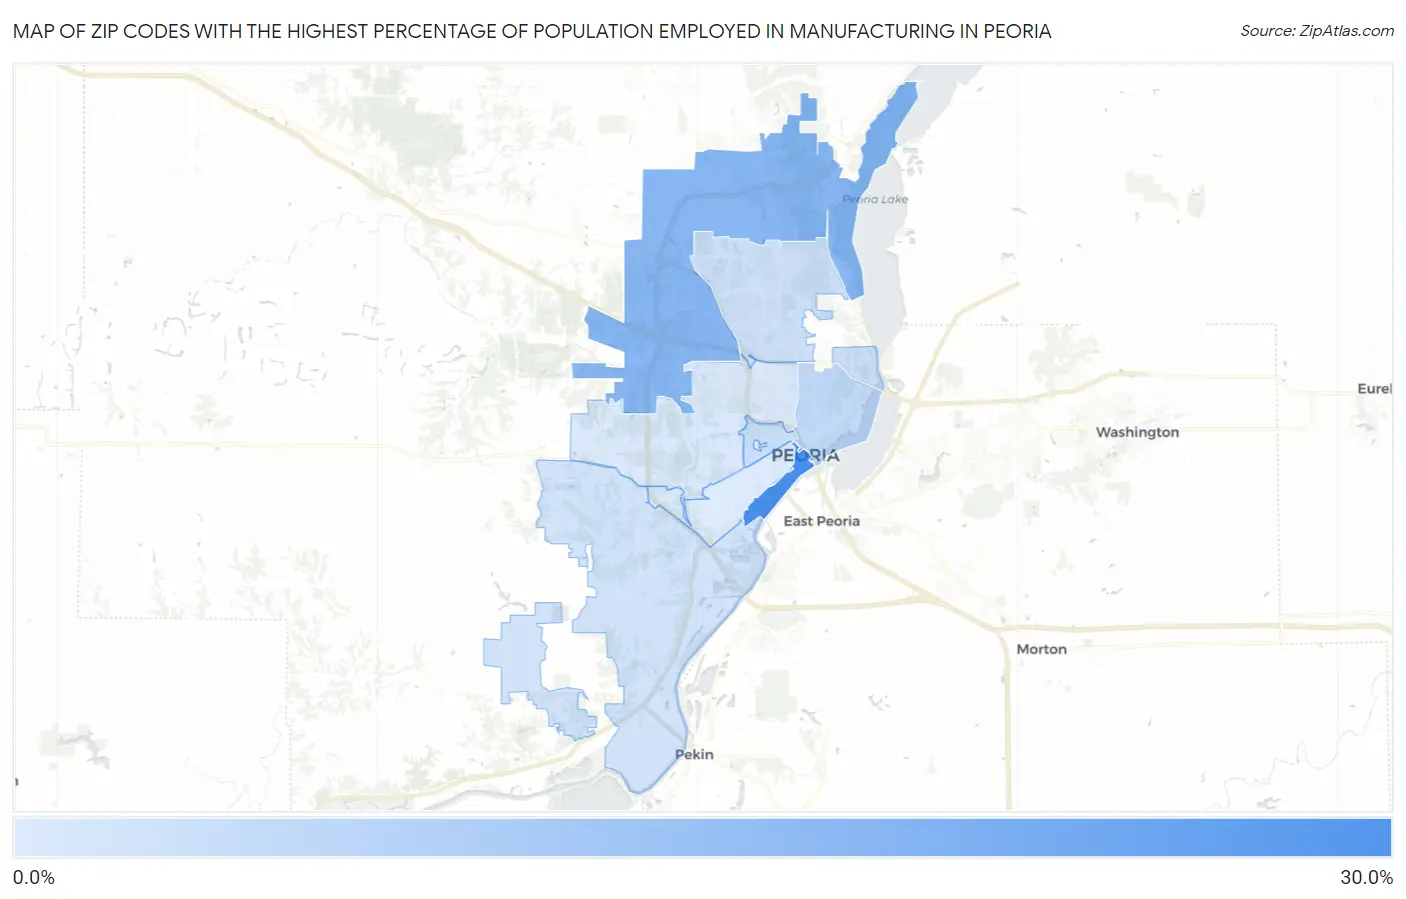
Map of Zip Codes with the Highest Percentage of Population Employed in Manufacturing in Peoria
0.0%
30.0%
Zip Codes with the Highest Percentage of Population Employed in Manufacturing in Peoria, IL
| Zip Code | % Employed | vs State | vs National | |
| 1. | 61602 | 27.6% | 11.6%(+15.9)#67 | 10.0%(+17.6)#1,775 |
| 2. | 61615 | 19.6% | 11.6%(+7.95)#231 | 10.0%(+9.60)#5,146 |
| 3. | 61603 | 12.9% | 11.6%(+1.26)#633 | 10.0%(+2.92)#11,482 |
| 4. | 61606 | 12.1% | 11.6%(+0.414)#697 | 10.0%(+2.07)#12,619 |
| 5. | 61614 | 11.7% | 11.6%(+0.057)#720 | 10.0%(+1.71)#13,112 |
| 6. | 61607 | 11.2% | 11.6%(-0.474)#763 | 10.0%(+1.18)#13,902 |
| 7. | 61604 | 10.2% | 11.6%(-1.40)#864 | 10.0%(+0.257)#15,374 |
| 8. | 61605 | 10.0% | 11.6%(-1.70)#900 | 10.0%(-0.040)#15,852 |
1
Common Questions
What are the Top 5 Zip Codes with the Highest Percentage of Population Employed in Manufacturing in Peoria, IL?
Top 5 Zip Codes with the Highest Percentage of Population Employed in Manufacturing in Peoria, IL are:
What zip code has the Highest Percentage of Population Employed in Manufacturing in Peoria, IL?
61602 has the Highest Percentage of Population Employed in Manufacturing in Peoria, IL with 27.6%.
What is the Percentage of Population Employed in Manufacturing in Peoria, IL?
Percentage of Population Employed in Manufacturing in Peoria is 15.1%.
What is the Percentage of Population Employed in Manufacturing in Illinois?
Percentage of Population Employed in Manufacturing in Illinois is 11.6%.
What is the Percentage of Population Employed in Manufacturing in the United States?
Percentage of Population Employed in Manufacturing in the United States is 10.0%.