Zip Codes with the Highest Percentage of Population Employed in Installation, Maintenance & Repair in Arlington Heights, IL
RELATED REPORTS & OPTIONS
Installation, Maintenance & Repair
Arlington Heights
Compare Zip Codes
Map of Zip Codes with the Highest Percentage of Population Employed in Installation, Maintenance & Repair in Arlington Heights
1.5%
1.6%
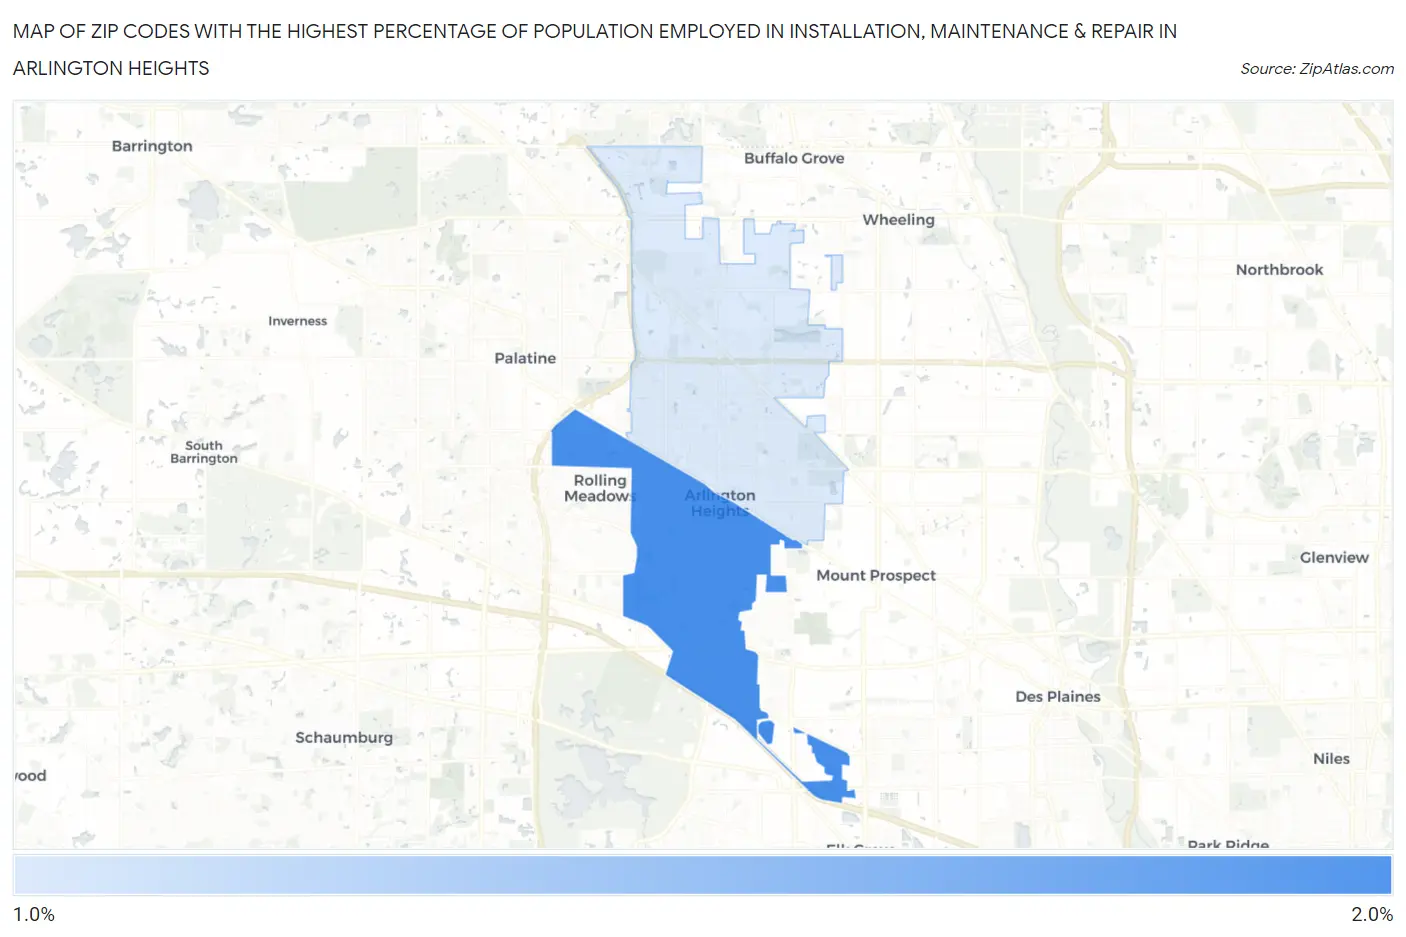
Zip Codes with the Highest Percentage of Population Employed in Installation, Maintenance & Repair in Arlington Heights, IL
| Zip Code | % Employed | vs State | vs National | |
| 1. | 60005 | 1.6% | 2.7%(-1.18)#1,070 | 3.1%(-1.52)#23,963 |
| 2. | 60004 | 1.5% | 2.7%(-1.26)#1,092 | 3.1%(-1.60)#24,297 |
1
Common Questions
What are the Top Zip Codes with the Highest Percentage of Population Employed in Installation, Maintenance & Repair in Arlington Heights, IL?
Top Zip Codes with the Highest Percentage of Population Employed in Installation, Maintenance & Repair in Arlington Heights, IL are:
What zip code has the Highest Percentage of Population Employed in Installation, Maintenance & Repair in Arlington Heights, IL?
60005 has the Highest Percentage of Population Employed in Installation, Maintenance & Repair in Arlington Heights, IL with 1.6%.
What is the Percentage of Population Employed in Installation, Maintenance & Repair in Arlington Heights, IL?
Percentage of Population Employed in Installation, Maintenance & Repair in Arlington Heights is 1.5%.
What is the Percentage of Population Employed in Installation, Maintenance & Repair in Illinois?
Percentage of Population Employed in Installation, Maintenance & Repair in Illinois is 2.7%.
What is the Percentage of Population Employed in Installation, Maintenance & Repair in the United States?
Percentage of Population Employed in Installation, Maintenance & Repair in the United States is 3.1%.