Zip Codes with the Highest Percentage of Population Employed in Security & Protection in Griffin, GA
RELATED REPORTS & OPTIONS
Security & Protection
Griffin
Compare Zip Codes
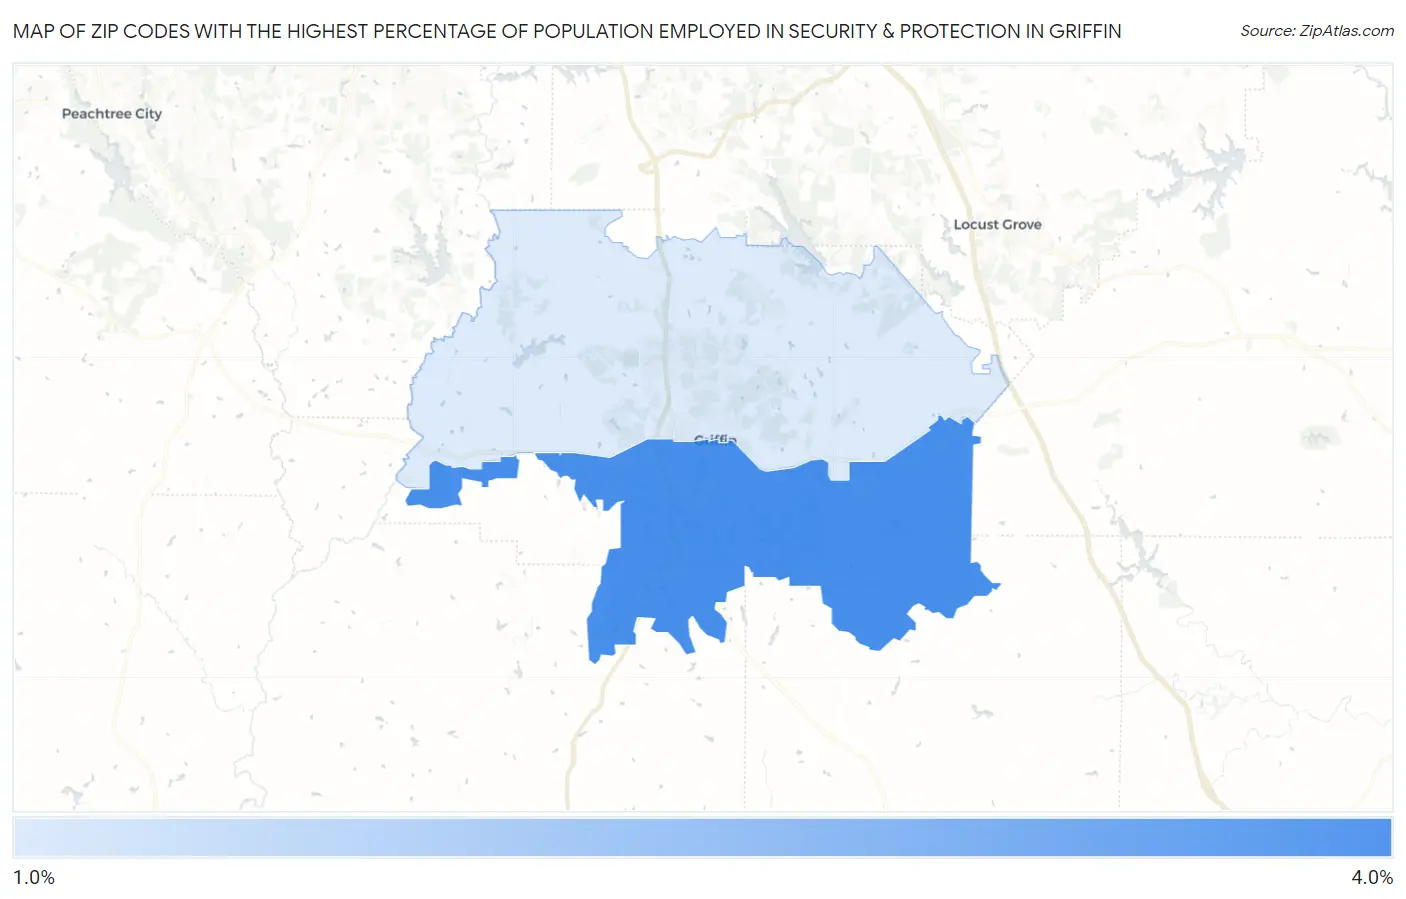
Map of Zip Codes with the Highest Percentage of Population Employed in Security & Protection in Griffin
2.0%
3.8%
Zip Codes with the Highest Percentage of Population Employed in Security & Protection in Griffin, GA
| Zip Code | % Employed | vs State | vs National | |
| 1. | 30224 | 3.8% | 2.2%(+1.61)#148 | 2.1%(+1.63)#4,950 |
| 2. | 30223 | 2.0% | 2.2%(-0.199)#376 | 2.1%(-0.176)#12,743 |
1
Common Questions
What are the Top Zip Codes with the Highest Percentage of Population Employed in Security & Protection in Griffin, GA?
Top Zip Codes with the Highest Percentage of Population Employed in Security & Protection in Griffin, GA are:
What zip code has the Highest Percentage of Population Employed in Security & Protection in Griffin, GA?
30224 has the Highest Percentage of Population Employed in Security & Protection in Griffin, GA with 3.8%.
What is the Percentage of Population Employed in Security & Protection in Griffin, GA?
Percentage of Population Employed in Security & Protection in Griffin is 3.4%.
What is the Percentage of Population Employed in Security & Protection in Georgia?
Percentage of Population Employed in Security & Protection in Georgia is 2.2%.
What is the Percentage of Population Employed in Security & Protection in the United States?
Percentage of Population Employed in Security & Protection in the United States is 2.1%.