Zip Codes with the Highest Percentage of Population Employed in Administrative & Support Services in Lawrenceville, GA
RELATED REPORTS & OPTIONS
Administrative & Support Services
Lawrenceville
Compare Zip Codes
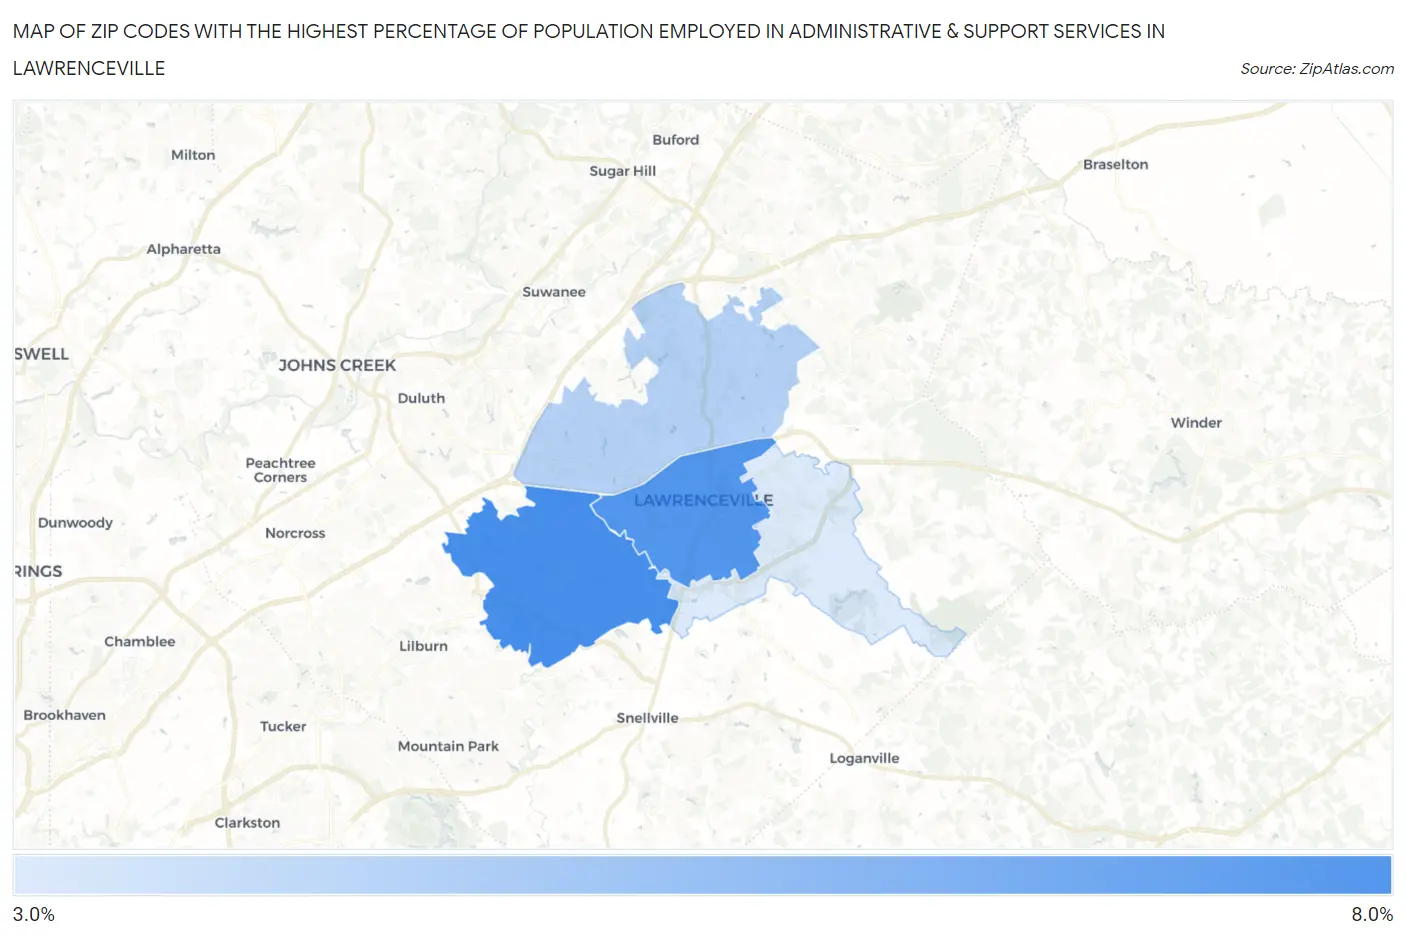
Map of Zip Codes with the Highest Percentage of Population Employed in Administrative & Support Services in Lawrenceville
4.0%
7.1%
Zip Codes with the Highest Percentage of Population Employed in Administrative & Support Services in Lawrenceville, GA
| Zip Code | % Employed | vs State | vs National | |
| 1. | 30044 | 7.1% | 4.8%(+2.26)#101 | 4.1%(+2.92)#3,136 |
| 2. | 30046 | 6.8% | 4.8%(+2.00)#115 | 4.1%(+2.67)#3,463 |
| 3. | 30043 | 4.8% | 4.8%(-0.016)#256 | 4.1%(+0.652)#7,728 |
| 4. | 30045 | 4.0% | 4.8%(-0.837)#344 | 4.1%(-0.170)#10,791 |
1
Common Questions
What are the Top 3 Zip Codes with the Highest Percentage of Population Employed in Administrative & Support Services in Lawrenceville, GA?
Top 3 Zip Codes with the Highest Percentage of Population Employed in Administrative & Support Services in Lawrenceville, GA are:
What zip code has the Highest Percentage of Population Employed in Administrative & Support Services in Lawrenceville, GA?
30044 has the Highest Percentage of Population Employed in Administrative & Support Services in Lawrenceville, GA with 7.1%.
What is the Percentage of Population Employed in Administrative & Support Services in Lawrenceville, GA?
Percentage of Population Employed in Administrative & Support Services in Lawrenceville is 7.4%.
What is the Percentage of Population Employed in Administrative & Support Services in Georgia?
Percentage of Population Employed in Administrative & Support Services in Georgia is 4.8%.
What is the Percentage of Population Employed in Administrative & Support Services in the United States?
Percentage of Population Employed in Administrative & Support Services in the United States is 4.1%.