Yakama vs Immigrants from Nicaragua Married-couple Households
COMPARE
Yakama
Immigrants from Nicaragua
Married-couple Households
Married-couple Households Comparison
Yakama
Immigrants from Nicaragua
45.2%
MARRIED-COUPLE HOUSEHOLDS
5.8/ 100
METRIC RATING
213th/ 347
METRIC RANK
44.5%
MARRIED-COUPLE HOUSEHOLDS
1.2/ 100
METRIC RATING
235th/ 347
METRIC RANK
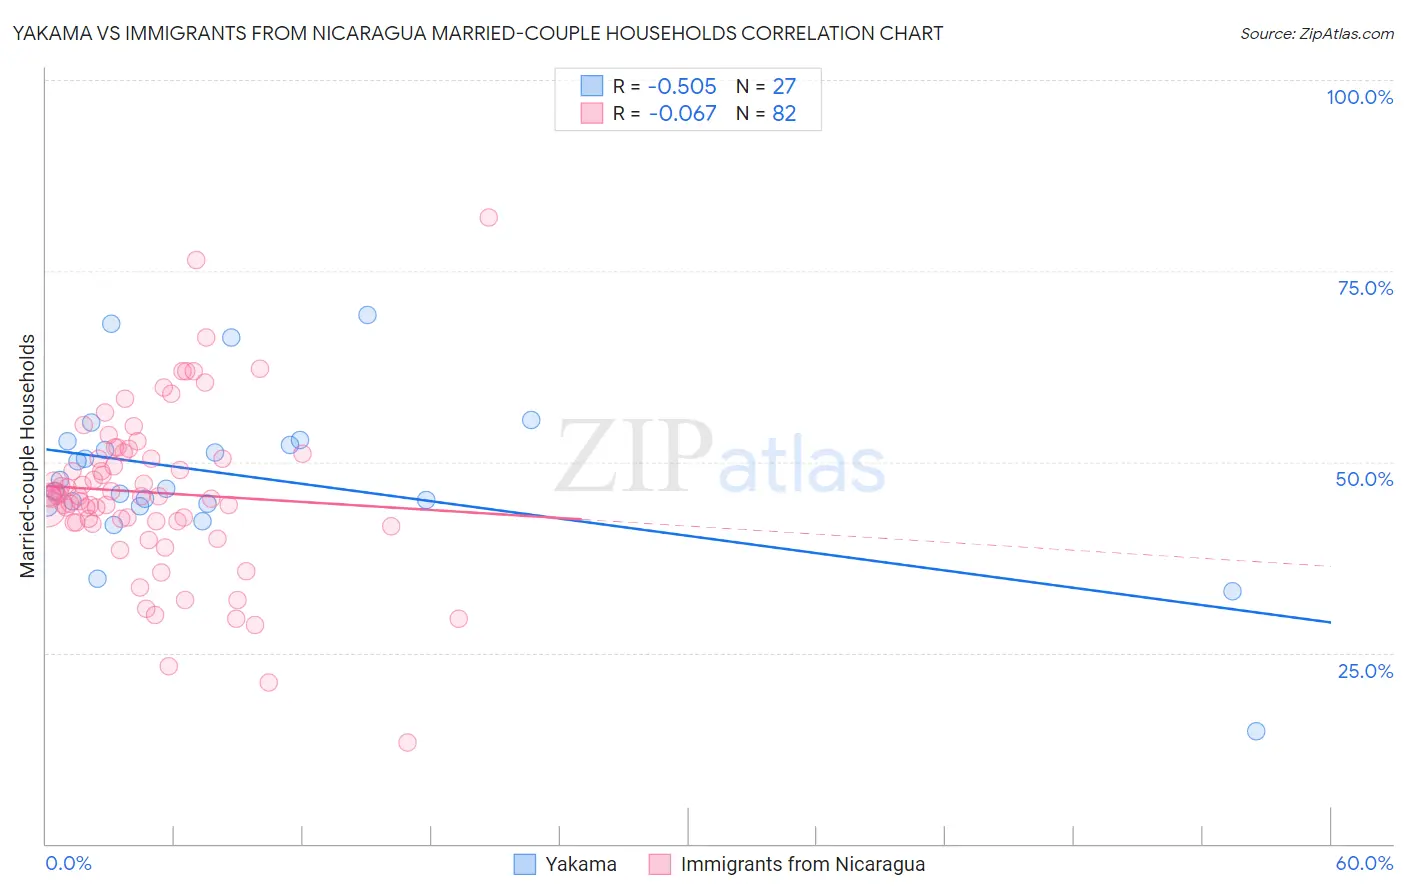
Yakama vs Immigrants from Nicaragua Married-couple Households Correlation Chart
The statistical analysis conducted on geographies consisting of 19,917,879 people shows a substantial negative correlation between the proportion of Yakama and percentage of married-couple family households in the United States with a correlation coefficient (R) of -0.505 and weighted average of 45.2%. Similarly, the statistical analysis conducted on geographies consisting of 236,322,720 people shows a slight negative correlation between the proportion of Immigrants from Nicaragua and percentage of married-couple family households in the United States with a correlation coefficient (R) of -0.067 and weighted average of 44.5%, a difference of 1.6%.
Married-couple Households Correlation Summary
| Measurement | Yakama | Immigrants from Nicaragua |
| Minimum | 14.7% | 13.2% |
| Maximum | 69.2% | 82.0% |
| Range | 54.6% | 68.8% |
| Mean | 48.0% | 46.0% |
| Median | 46.5% | 45.5% |
| Interquartile 25% (IQ1) | 44.3% | 42.1% |
| Interquartile 75% (IQ3) | 52.8% | 51.0% |
| Interquartile Range (IQR) | 8.5% | 9.0% |
| Standard Deviation (Sample) | 10.8% | 10.9% |
| Standard Deviation (Population) | 10.6% | 10.9% |
Similar Demographics by Married-couple Households
Demographics Similar to Yakama by Married-couple Households
In terms of married-couple households, the demographic groups most similar to Yakama are Japanese (45.2%, a difference of 0.020%), Immigrants from Nepal (45.2%, a difference of 0.040%), Immigrants from Portugal (45.2%, a difference of 0.050%), Panamanian (45.2%, a difference of 0.070%), and Immigrants from the Azores (45.2%, a difference of 0.090%).
| Demographics | Rating | Rank | Married-couple Households |
| Uruguayans | 10.4 /100 | #206 | Poor 45.5% |
| Immigrants | France | 8.8 /100 | #207 | Tragic 45.4% |
| Hispanics or Latinos | 8.7 /100 | #208 | Tragic 45.4% |
| Immigrants | Uzbekistan | 8.4 /100 | #209 | Tragic 45.4% |
| Cubans | 7.7 /100 | #210 | Tragic 45.4% |
| Immigrants | Spain | 7.3 /100 | #211 | Tragic 45.3% |
| Creek | 6.4 /100 | #212 | Tragic 45.3% |
| Yakama | 5.8 /100 | #213 | Tragic 45.2% |
| Japanese | 5.7 /100 | #214 | Tragic 45.2% |
| Immigrants | Nepal | 5.6 /100 | #215 | Tragic 45.2% |
| Immigrants | Portugal | 5.6 /100 | #216 | Tragic 45.2% |
| Panamanians | 5.5 /100 | #217 | Tragic 45.2% |
| Immigrants | Azores | 5.3 /100 | #218 | Tragic 45.2% |
| Nicaraguans | 5.3 /100 | #219 | Tragic 45.2% |
| Immigrants | Thailand | 5.1 /100 | #220 | Tragic 45.2% |
Demographics Similar to Immigrants from Nicaragua by Married-couple Households
In terms of married-couple households, the demographic groups most similar to Immigrants from Nicaragua are Yaqui (44.5%, a difference of 0.0%), Comanche (44.5%, a difference of 0.040%), Immigrants from Panama (44.6%, a difference of 0.070%), Immigrants from Uruguay (44.5%, a difference of 0.090%), and Spanish American (44.5%, a difference of 0.10%).
| Demographics | Rating | Rank | Married-couple Households |
| Kenyans | 1.7 /100 | #228 | Tragic 44.7% |
| Immigrants | Latin America | 1.6 /100 | #229 | Tragic 44.7% |
| Soviet Union | 1.6 /100 | #230 | Tragic 44.6% |
| Houma | 1.5 /100 | #231 | Tragic 44.6% |
| Marshallese | 1.5 /100 | #232 | Tragic 44.6% |
| Immigrants | Uganda | 1.5 /100 | #233 | Tragic 44.6% |
| Immigrants | Panama | 1.3 /100 | #234 | Tragic 44.6% |
| Immigrants | Nicaragua | 1.2 /100 | #235 | Tragic 44.5% |
| Yaqui | 1.2 /100 | #236 | Tragic 44.5% |
| Comanche | 1.2 /100 | #237 | Tragic 44.5% |
| Immigrants | Uruguay | 1.1 /100 | #238 | Tragic 44.5% |
| Spanish Americans | 1.1 /100 | #239 | Tragic 44.5% |
| Ute | 1.0 /100 | #240 | Tragic 44.4% |
| Immigrants | Bosnia and Herzegovina | 1.0 /100 | #241 | Tragic 44.4% |
| Immigrants | Albania | 1.0 /100 | #242 | Tragic 44.4% |