Yakama vs Immigrants from Kenya Family Households
COMPARE
Yakama
Immigrants from Kenya
Family Households
Family Households Comparison
Yakama
Immigrants from Kenya
69.3%
FAMILY HOUSEHOLDS
100.0/ 100
METRIC RATING
4th/ 347
METRIC RANK
62.3%
FAMILY HOUSEHOLDS
0.0/ 100
METRIC RATING
302nd/ 347
METRIC RANK
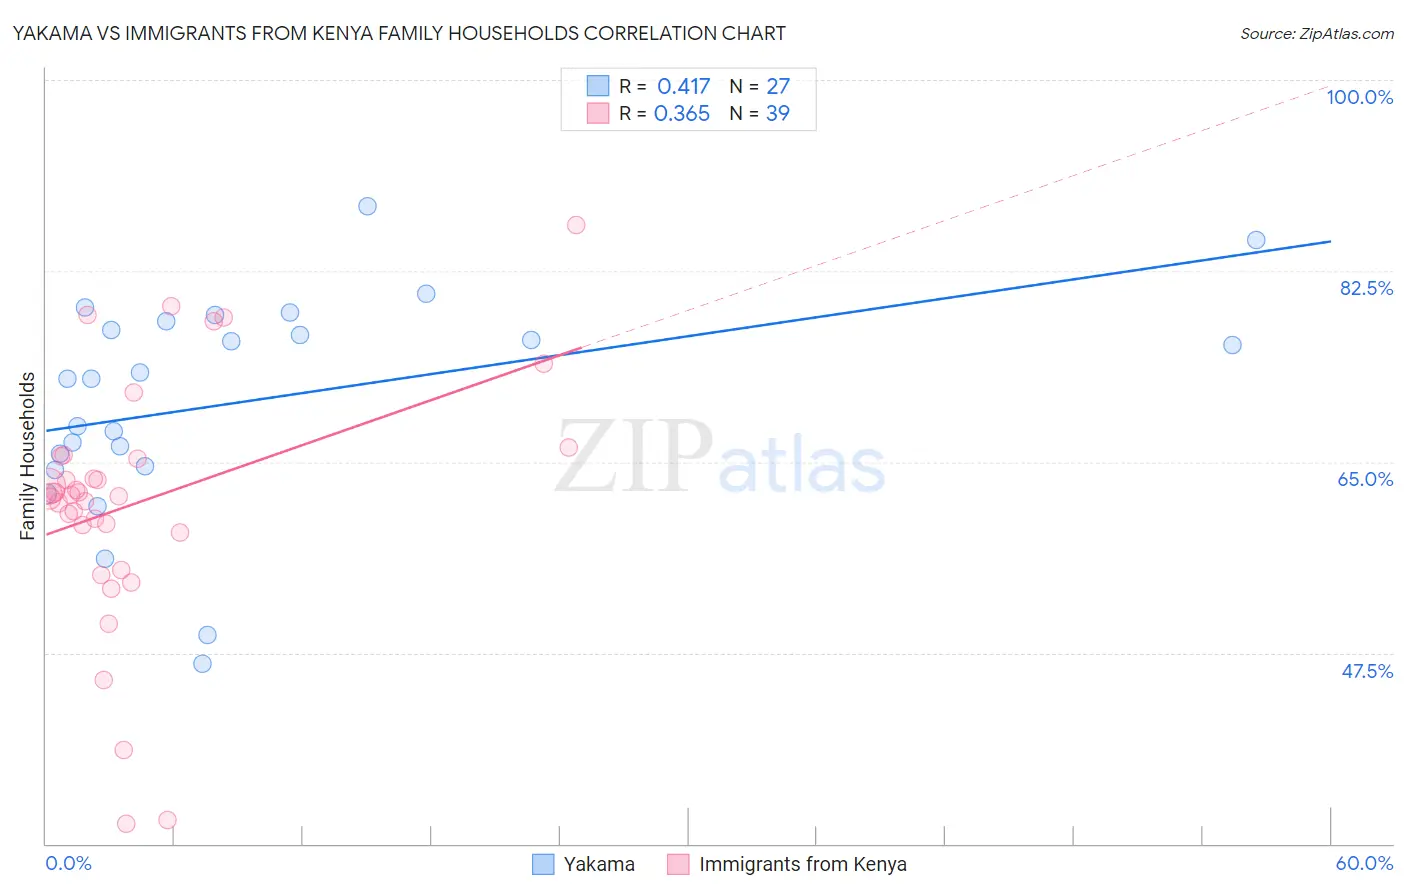
Yakama vs Immigrants from Kenya Family Households Correlation Chart
The statistical analysis conducted on geographies consisting of 19,917,879 people shows a moderate positive correlation between the proportion of Yakama and percentage of family households in the United States with a correlation coefficient (R) of 0.417 and weighted average of 69.3%. Similarly, the statistical analysis conducted on geographies consisting of 217,999,239 people shows a mild positive correlation between the proportion of Immigrants from Kenya and percentage of family households in the United States with a correlation coefficient (R) of 0.365 and weighted average of 62.3%, a difference of 11.2%.
Family Households Correlation Summary
| Measurement | Yakama | Immigrants from Kenya |
| Minimum | 46.6% | 31.8% |
| Maximum | 88.5% | 86.7% |
| Range | 41.9% | 54.9% |
| Mean | 70.6% | 61.3% |
| Median | 72.6% | 62.0% |
| Interquartile 25% (IQ1) | 64.6% | 58.5% |
| Interquartile 75% (IQ3) | 77.9% | 65.5% |
| Interquartile Range (IQR) | 13.3% | 7.0% |
| Standard Deviation (Sample) | 10.1% | 11.5% |
| Standard Deviation (Population) | 9.9% | 11.4% |
Similar Demographics by Family Households
Demographics Similar to Yakama by Family Households
In terms of family households, the demographic groups most similar to Yakama are Yuman (69.3%, a difference of 0.030%), Immigrants from Mexico (69.1%, a difference of 0.26%), Tongan (69.6%, a difference of 0.44%), Mexican (69.0%, a difference of 0.47%), and Immigrants from Fiji (68.8%, a difference of 0.80%).
| Demographics | Rating | Rank | Family Households |
| Yup'ik | 100 /100 | #1 | Exceptional 72.4% |
| Spanish American Indians | 100.0 /100 | #2 | Exceptional 71.2% |
| Tongans | 100.0 /100 | #3 | Exceptional 69.6% |
| Yakama | 100.0 /100 | #4 | Exceptional 69.3% |
| Yuman | 100.0 /100 | #5 | Exceptional 69.3% |
| Immigrants | Mexico | 100.0 /100 | #6 | Exceptional 69.1% |
| Mexicans | 100.0 /100 | #7 | Exceptional 69.0% |
| Immigrants | Fiji | 100.0 /100 | #8 | Exceptional 68.8% |
| Native Hawaiians | 100.0 /100 | #9 | Exceptional 68.4% |
| Immigrants | Philippines | 100.0 /100 | #10 | Exceptional 68.3% |
| Immigrants | Central America | 100.0 /100 | #11 | Exceptional 68.3% |
| Koreans | 100.0 /100 | #12 | Exceptional 68.3% |
| Pueblo | 100.0 /100 | #13 | Exceptional 68.2% |
| Immigrants | Cuba | 100.0 /100 | #14 | Exceptional 68.2% |
| Assyrians/Chaldeans/Syriacs | 100.0 /100 | #15 | Exceptional 68.2% |
Demographics Similar to Immigrants from Kenya by Family Households
In terms of family households, the demographic groups most similar to Immigrants from Kenya are Immigrants from Albania (62.4%, a difference of 0.040%), Immigrants from Africa (62.4%, a difference of 0.060%), Cree (62.3%, a difference of 0.060%), Immigrants from Kuwait (62.4%, a difference of 0.070%), and Immigrants from Spain (62.4%, a difference of 0.13%).
| Demographics | Rating | Rank | Family Households |
| Okinawans | 0.0 /100 | #295 | Tragic 62.5% |
| Slovenes | 0.0 /100 | #296 | Tragic 62.4% |
| French American Indians | 0.0 /100 | #297 | Tragic 62.4% |
| Immigrants | Spain | 0.0 /100 | #298 | Tragic 62.4% |
| Immigrants | Kuwait | 0.0 /100 | #299 | Tragic 62.4% |
| Immigrants | Africa | 0.0 /100 | #300 | Tragic 62.4% |
| Immigrants | Albania | 0.0 /100 | #301 | Tragic 62.4% |
| Immigrants | Kenya | 0.0 /100 | #302 | Tragic 62.3% |
| Cree | 0.0 /100 | #303 | Tragic 62.3% |
| Iroquois | 0.0 /100 | #304 | Tragic 62.2% |
| Bermudans | 0.0 /100 | #305 | Tragic 62.2% |
| Africans | 0.0 /100 | #306 | Tragic 62.1% |
| Immigrants | Norway | 0.0 /100 | #307 | Tragic 62.1% |
| Chippewa | 0.0 /100 | #308 | Tragic 62.1% |
| Sub-Saharan Africans | 0.0 /100 | #309 | Tragic 62.1% |