Slovak vs Immigrants from Kenya Family Households
COMPARE
Slovak
Immigrants from Kenya
Family Households
Family Households Comparison
Slovaks
Immigrants from Kenya
63.3%
FAMILY HOUSEHOLDS
1.0/ 100
METRIC RATING
254th/ 347
METRIC RANK
62.3%
FAMILY HOUSEHOLDS
0.0/ 100
METRIC RATING
302nd/ 347
METRIC RANK
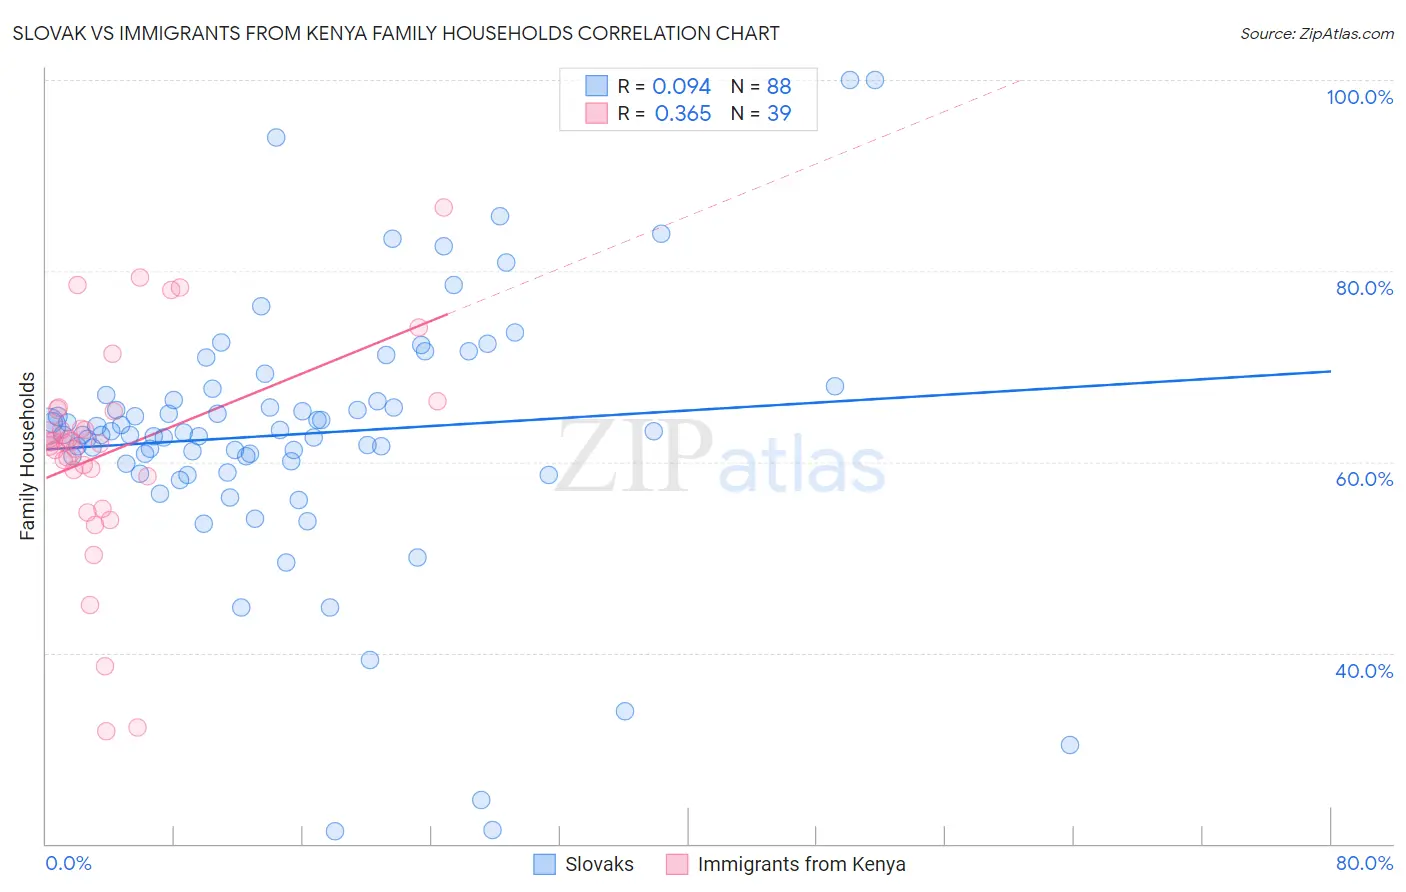
Slovak vs Immigrants from Kenya Family Households Correlation Chart
The statistical analysis conducted on geographies consisting of 397,683,029 people shows a slight positive correlation between the proportion of Slovaks and percentage of family households in the United States with a correlation coefficient (R) of 0.094 and weighted average of 63.3%. Similarly, the statistical analysis conducted on geographies consisting of 217,999,239 people shows a mild positive correlation between the proportion of Immigrants from Kenya and percentage of family households in the United States with a correlation coefficient (R) of 0.365 and weighted average of 62.3%, a difference of 1.6%.
Family Households Correlation Summary
| Measurement | Slovak | Immigrants from Kenya |
| Minimum | 21.3% | 31.8% |
| Maximum | 100.0% | 86.7% |
| Range | 78.7% | 54.9% |
| Mean | 62.9% | 61.3% |
| Median | 63.0% | 62.0% |
| Interquartile 25% (IQ1) | 59.9% | 58.5% |
| Interquartile 75% (IQ3) | 66.7% | 65.5% |
| Interquartile Range (IQR) | 6.8% | 7.0% |
| Standard Deviation (Sample) | 13.6% | 11.5% |
| Standard Deviation (Population) | 13.5% | 11.4% |
Similar Demographics by Family Households
Demographics Similar to Slovaks by Family Households
In terms of family households, the demographic groups most similar to Slovaks are Immigrants from Dominican Republic (63.3%, a difference of 0.010%), Potawatomi (63.3%, a difference of 0.020%), Bahamian (63.3%, a difference of 0.030%), Taiwanese (63.3%, a difference of 0.040%), and Luxembourger (63.3%, a difference of 0.050%).
| Demographics | Rating | Rank | Family Households |
| Immigrants | Uzbekistan | 1.5 /100 | #247 | Tragic 63.4% |
| Dominicans | 1.5 /100 | #248 | Tragic 63.4% |
| Russians | 1.4 /100 | #249 | Tragic 63.4% |
| Immigrants | Japan | 1.4 /100 | #250 | Tragic 63.4% |
| Taiwanese | 1.2 /100 | #251 | Tragic 63.3% |
| Bahamians | 1.1 /100 | #252 | Tragic 63.3% |
| Immigrants | Dominican Republic | 1.0 /100 | #253 | Tragic 63.3% |
| Slovaks | 1.0 /100 | #254 | Tragic 63.3% |
| Potawatomi | 1.0 /100 | #255 | Tragic 63.3% |
| Luxembourgers | 0.9 /100 | #256 | Tragic 63.3% |
| Icelanders | 0.8 /100 | #257 | Tragic 63.3% |
| Immigrants | Barbados | 0.7 /100 | #258 | Tragic 63.2% |
| Immigrants | Western Europe | 0.6 /100 | #259 | Tragic 63.2% |
| Cypriots | 0.6 /100 | #260 | Tragic 63.2% |
| Immigrants | Russia | 0.6 /100 | #261 | Tragic 63.2% |
Demographics Similar to Immigrants from Kenya by Family Households
In terms of family households, the demographic groups most similar to Immigrants from Kenya are Immigrants from Albania (62.4%, a difference of 0.040%), Immigrants from Africa (62.4%, a difference of 0.060%), Cree (62.3%, a difference of 0.060%), Immigrants from Kuwait (62.4%, a difference of 0.070%), and Immigrants from Spain (62.4%, a difference of 0.13%).
| Demographics | Rating | Rank | Family Households |
| Okinawans | 0.0 /100 | #295 | Tragic 62.5% |
| Slovenes | 0.0 /100 | #296 | Tragic 62.4% |
| French American Indians | 0.0 /100 | #297 | Tragic 62.4% |
| Immigrants | Spain | 0.0 /100 | #298 | Tragic 62.4% |
| Immigrants | Kuwait | 0.0 /100 | #299 | Tragic 62.4% |
| Immigrants | Africa | 0.0 /100 | #300 | Tragic 62.4% |
| Immigrants | Albania | 0.0 /100 | #301 | Tragic 62.4% |
| Immigrants | Kenya | 0.0 /100 | #302 | Tragic 62.3% |
| Cree | 0.0 /100 | #303 | Tragic 62.3% |
| Iroquois | 0.0 /100 | #304 | Tragic 62.2% |
| Bermudans | 0.0 /100 | #305 | Tragic 62.2% |
| Africans | 0.0 /100 | #306 | Tragic 62.1% |
| Immigrants | Norway | 0.0 /100 | #307 | Tragic 62.1% |
| Chippewa | 0.0 /100 | #308 | Tragic 62.1% |
| Sub-Saharan Africans | 0.0 /100 | #309 | Tragic 62.1% |