Arapaho vs Immigrants from Kenya Family Households
COMPARE
Arapaho
Immigrants from Kenya
Family Households
Family Households Comparison
Arapaho
Immigrants from Kenya
66.5%
FAMILY HOUSEHOLDS
100.0/ 100
METRIC RATING
46th/ 347
METRIC RANK
62.3%
FAMILY HOUSEHOLDS
0.0/ 100
METRIC RATING
302nd/ 347
METRIC RANK
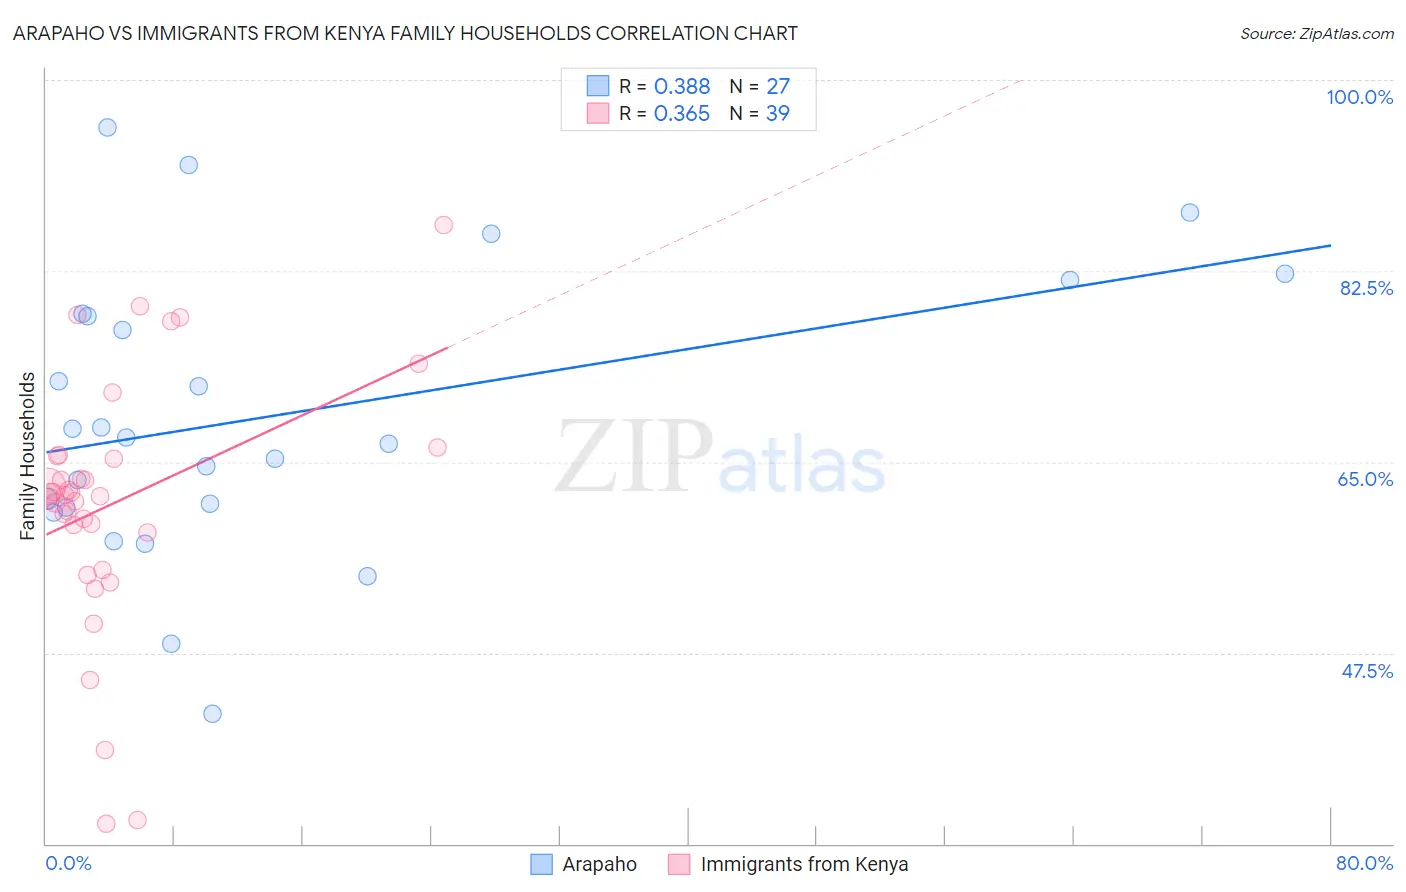
Arapaho vs Immigrants from Kenya Family Households Correlation Chart
The statistical analysis conducted on geographies consisting of 29,778,233 people shows a mild positive correlation between the proportion of Arapaho and percentage of family households in the United States with a correlation coefficient (R) of 0.388 and weighted average of 66.5%. Similarly, the statistical analysis conducted on geographies consisting of 217,999,239 people shows a mild positive correlation between the proportion of Immigrants from Kenya and percentage of family households in the United States with a correlation coefficient (R) of 0.365 and weighted average of 62.3%, a difference of 6.6%.
Family Households Correlation Summary
| Measurement | Arapaho | Immigrants from Kenya |
| Minimum | 41.9% | 31.8% |
| Maximum | 95.7% | 86.7% |
| Range | 53.8% | 54.9% |
| Mean | 69.3% | 61.3% |
| Median | 67.2% | 62.0% |
| Interquartile 25% (IQ1) | 60.8% | 58.5% |
| Interquartile 75% (IQ3) | 78.6% | 65.5% |
| Interquartile Range (IQR) | 17.8% | 7.0% |
| Standard Deviation (Sample) | 13.1% | 11.5% |
| Standard Deviation (Population) | 12.9% | 11.4% |
Similar Demographics by Family Households
Demographics Similar to Arapaho by Family Households
In terms of family households, the demographic groups most similar to Arapaho are Venezuelan (66.5%, a difference of 0.020%), Bolivian (66.5%, a difference of 0.030%), Asian (66.5%, a difference of 0.050%), Immigrants from Venezuela (66.4%, a difference of 0.050%), and Apache (66.5%, a difference of 0.090%).
| Demographics | Rating | Rank | Family Households |
| Immigrants | El Salvador | 100.0 /100 | #39 | Exceptional 67.0% |
| Guamanians/Chamorros | 100.0 /100 | #40 | Exceptional 66.6% |
| Immigrants | Bolivia | 100.0 /100 | #41 | Exceptional 66.6% |
| Menominee | 100.0 /100 | #42 | Exceptional 66.5% |
| Apache | 100.0 /100 | #43 | Exceptional 66.5% |
| Asians | 100.0 /100 | #44 | Exceptional 66.5% |
| Venezuelans | 100.0 /100 | #45 | Exceptional 66.5% |
| Arapaho | 100.0 /100 | #46 | Exceptional 66.5% |
| Bolivians | 100.0 /100 | #47 | Exceptional 66.5% |
| Immigrants | Venezuela | 100.0 /100 | #48 | Exceptional 66.4% |
| Immigrants | South Central Asia | 100.0 /100 | #49 | Exceptional 66.4% |
| Navajo | 100.0 /100 | #50 | Exceptional 66.4% |
| Natives/Alaskans | 100.0 /100 | #51 | Exceptional 66.4% |
| Colombians | 100.0 /100 | #52 | Exceptional 66.3% |
| Afghans | 100.0 /100 | #53 | Exceptional 66.3% |
Demographics Similar to Immigrants from Kenya by Family Households
In terms of family households, the demographic groups most similar to Immigrants from Kenya are Immigrants from Albania (62.4%, a difference of 0.040%), Immigrants from Africa (62.4%, a difference of 0.060%), Cree (62.3%, a difference of 0.060%), Immigrants from Kuwait (62.4%, a difference of 0.070%), and Immigrants from Spain (62.4%, a difference of 0.13%).
| Demographics | Rating | Rank | Family Households |
| Okinawans | 0.0 /100 | #295 | Tragic 62.5% |
| Slovenes | 0.0 /100 | #296 | Tragic 62.4% |
| French American Indians | 0.0 /100 | #297 | Tragic 62.4% |
| Immigrants | Spain | 0.0 /100 | #298 | Tragic 62.4% |
| Immigrants | Kuwait | 0.0 /100 | #299 | Tragic 62.4% |
| Immigrants | Africa | 0.0 /100 | #300 | Tragic 62.4% |
| Immigrants | Albania | 0.0 /100 | #301 | Tragic 62.4% |
| Immigrants | Kenya | 0.0 /100 | #302 | Tragic 62.3% |
| Cree | 0.0 /100 | #303 | Tragic 62.3% |
| Iroquois | 0.0 /100 | #304 | Tragic 62.2% |
| Bermudans | 0.0 /100 | #305 | Tragic 62.2% |
| Africans | 0.0 /100 | #306 | Tragic 62.1% |
| Immigrants | Norway | 0.0 /100 | #307 | Tragic 62.1% |
| Chippewa | 0.0 /100 | #308 | Tragic 62.1% |
| Sub-Saharan Africans | 0.0 /100 | #309 | Tragic 62.1% |