Welsh vs Immigrants from Nigeria Married-couple Households
COMPARE
Welsh
Immigrants from Nigeria
Married-couple Households
Married-couple Households Comparison
Welsh
Immigrants from Nigeria
48.8%
MARRIED-COUPLE HOUSEHOLDS
99.5/ 100
METRIC RATING
44th/ 347
METRIC RANK
43.2%
MARRIED-COUPLE HOUSEHOLDS
0.1/ 100
METRIC RATING
272nd/ 347
METRIC RANK
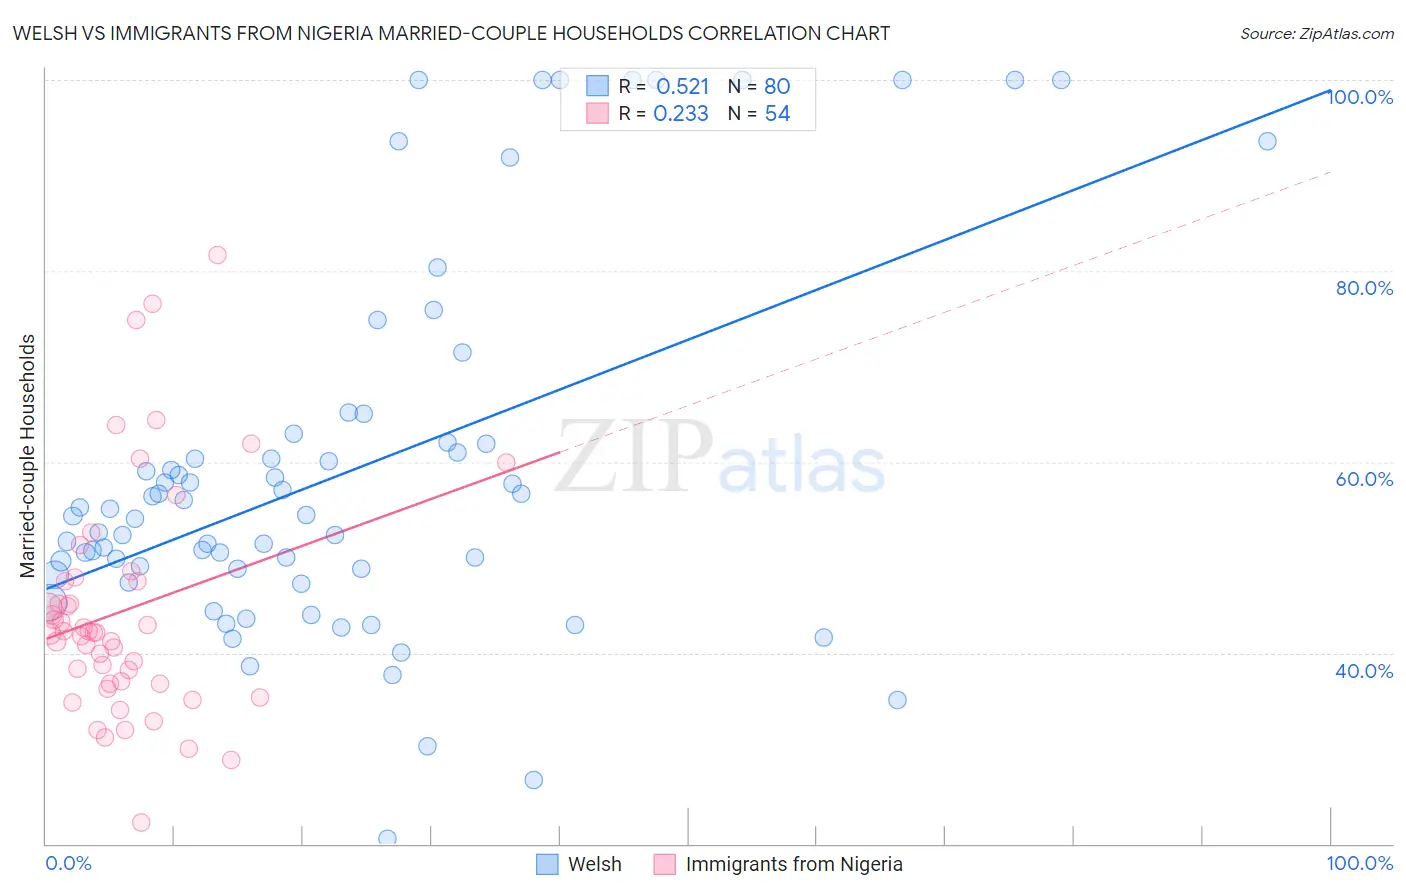
Welsh vs Immigrants from Nigeria Married-couple Households Correlation Chart
The statistical analysis conducted on geographies consisting of 528,152,714 people shows a substantial positive correlation between the proportion of Welsh and percentage of married-couple family households in the United States with a correlation coefficient (R) of 0.521 and weighted average of 48.8%. Similarly, the statistical analysis conducted on geographies consisting of 283,287,559 people shows a weak positive correlation between the proportion of Immigrants from Nigeria and percentage of married-couple family households in the United States with a correlation coefficient (R) of 0.233 and weighted average of 43.2%, a difference of 12.9%.
Married-couple Households Correlation Summary
| Measurement | Welsh | Immigrants from Nigeria |
| Minimum | 20.5% | 22.2% |
| Maximum | 100.0% | 81.7% |
| Range | 79.5% | 59.5% |
| Mean | 59.0% | 44.4% |
| Median | 54.3% | 42.1% |
| Interquartile 25% (IQ1) | 48.5% | 36.8% |
| Interquartile 75% (IQ3) | 62.0% | 47.5% |
| Interquartile Range (IQR) | 13.5% | 10.7% |
| Standard Deviation (Sample) | 19.3% | 12.0% |
| Standard Deviation (Population) | 19.2% | 11.9% |
Similar Demographics by Married-couple Households
Demographics Similar to Welsh by Married-couple Households
In terms of married-couple households, the demographic groups most similar to Welsh are Immigrants from Eastern Asia (48.8%, a difference of 0.030%), Immigrants from Iran (48.8%, a difference of 0.050%), Tsimshian (48.7%, a difference of 0.080%), Immigrants from Vietnam (48.8%, a difference of 0.10%), and British (48.7%, a difference of 0.10%).
| Demographics | Rating | Rank | Married-couple Households |
| Sri Lankans | 99.7 /100 | #37 | Exceptional 49.0% |
| Greeks | 99.7 /100 | #38 | Exceptional 48.9% |
| Lithuanians | 99.6 /100 | #39 | Exceptional 48.9% |
| Immigrants | Bolivia | 99.6 /100 | #40 | Exceptional 48.9% |
| Immigrants | Lebanon | 99.6 /100 | #41 | Exceptional 48.9% |
| Immigrants | Vietnam | 99.6 /100 | #42 | Exceptional 48.8% |
| Immigrants | Iran | 99.6 /100 | #43 | Exceptional 48.8% |
| Welsh | 99.5 /100 | #44 | Exceptional 48.8% |
| Immigrants | Eastern Asia | 99.5 /100 | #45 | Exceptional 48.8% |
| Tsimshian | 99.5 /100 | #46 | Exceptional 48.7% |
| British | 99.5 /100 | #47 | Exceptional 48.7% |
| Indians (Asian) | 99.4 /100 | #48 | Exceptional 48.7% |
| Immigrants | Sri Lanka | 99.4 /100 | #49 | Exceptional 48.7% |
| Samoans | 99.4 /100 | #50 | Exceptional 48.7% |
| Eastern Europeans | 99.3 /100 | #51 | Exceptional 48.6% |
Demographics Similar to Immigrants from Nigeria by Married-couple Households
In terms of married-couple households, the demographic groups most similar to Immigrants from Nigeria are Ethiopian (43.2%, a difference of 0.10%), Guatemalan (43.3%, a difference of 0.11%), Nigerian (43.2%, a difference of 0.11%), Yuman (43.3%, a difference of 0.21%), and Immigrants from Bangladesh (43.1%, a difference of 0.25%).
| Demographics | Rating | Rank | Married-couple Households |
| Moroccans | 0.1 /100 | #265 | Tragic 43.5% |
| Ecuadorians | 0.1 /100 | #266 | Tragic 43.5% |
| Natives/Alaskans | 0.1 /100 | #267 | Tragic 43.5% |
| Immigrants | Burma/Myanmar | 0.1 /100 | #268 | Tragic 43.4% |
| Immigrants | Sierra Leone | 0.1 /100 | #269 | Tragic 43.3% |
| Yuman | 0.1 /100 | #270 | Tragic 43.3% |
| Guatemalans | 0.1 /100 | #271 | Tragic 43.3% |
| Immigrants | Nigeria | 0.1 /100 | #272 | Tragic 43.2% |
| Ethiopians | 0.1 /100 | #273 | Tragic 43.2% |
| Nigerians | 0.1 /100 | #274 | Tragic 43.2% |
| Immigrants | Bangladesh | 0.0 /100 | #275 | Tragic 43.1% |
| Immigrants | Ethiopia | 0.0 /100 | #276 | Tragic 43.1% |
| Immigrants | Eastern Africa | 0.0 /100 | #277 | Tragic 42.9% |
| Immigrants | Africa | 0.0 /100 | #278 | Tragic 42.9% |
| Sierra Leoneans | 0.0 /100 | #279 | Tragic 42.9% |