Ute vs Immigrants from Uganda Family Households with Children
COMPARE
Ute
Immigrants from Uganda
Family Households with Children
Family Households with Children Comparison
Ute
Immigrants from Uganda
28.2%
FAMILY HOUSEHOLDS WITH CHILDREN
99.1/ 100
METRIC RATING
96th/ 347
METRIC RANK
28.0%
FAMILY HOUSEHOLDS WITH CHILDREN
97.7/ 100
METRIC RATING
107th/ 347
METRIC RANK
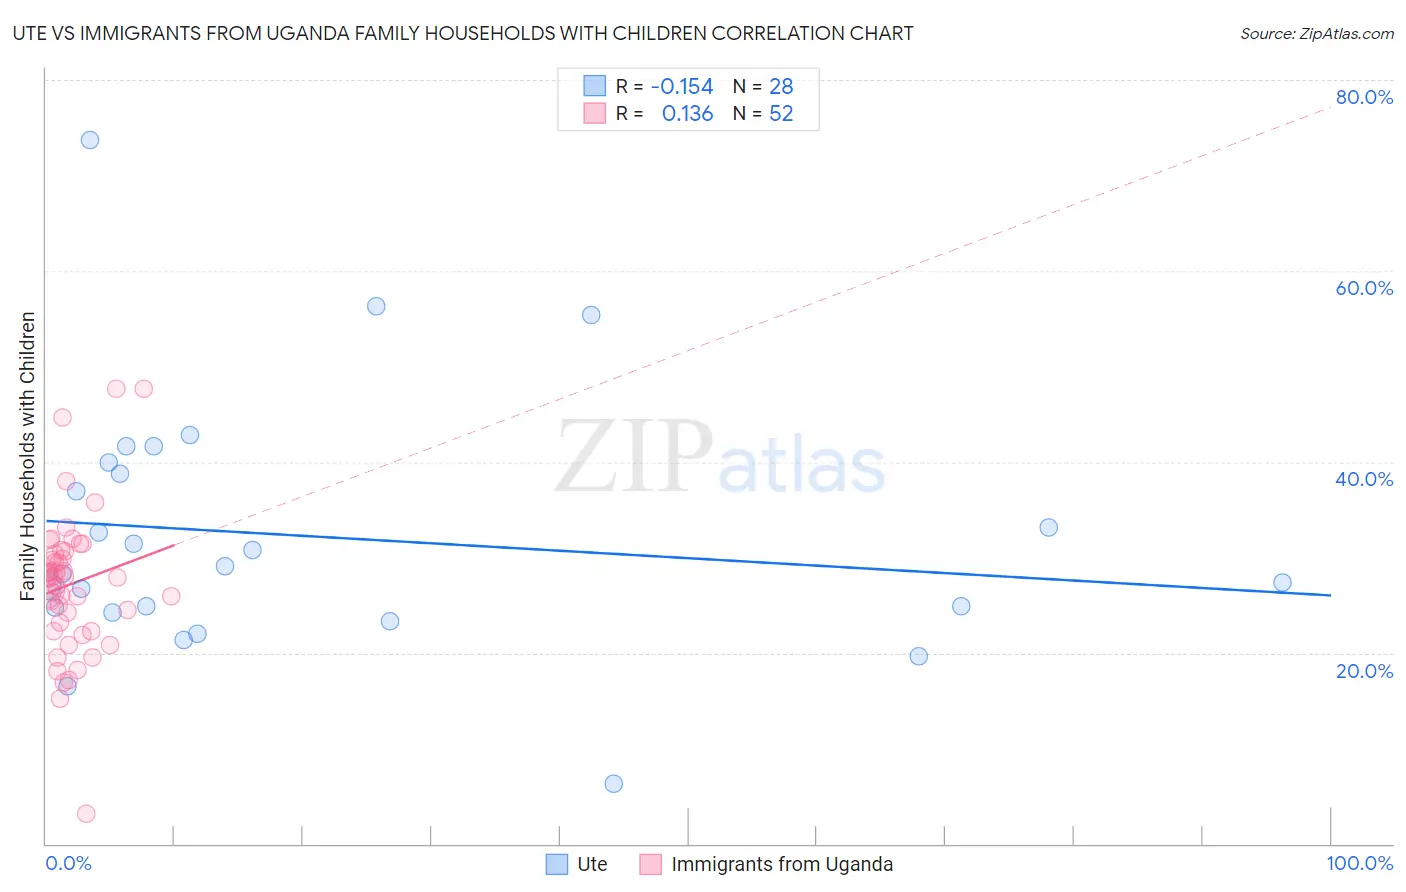
Ute vs Immigrants from Uganda Family Households with Children Correlation Chart
The statistical analysis conducted on geographies consisting of 55,657,508 people shows a poor negative correlation between the proportion of Ute and percentage of family households with children in the United States with a correlation coefficient (R) of -0.154 and weighted average of 28.2%. Similarly, the statistical analysis conducted on geographies consisting of 125,961,015 people shows a poor positive correlation between the proportion of Immigrants from Uganda and percentage of family households with children in the United States with a correlation coefficient (R) of 0.136 and weighted average of 28.0%, a difference of 0.48%.
Family Households with Children Correlation Summary
| Measurement | Ute | Immigrants from Uganda |
| Minimum | 6.3% | 3.2% |
| Maximum | 73.7% | 47.7% |
| Range | 67.4% | 44.5% |
| Mean | 32.2% | 27.2% |
| Median | 28.7% | 28.0% |
| Interquartile 25% (IQ1) | 24.5% | 22.7% |
| Interquartile 75% (IQ3) | 39.3% | 30.5% |
| Interquartile Range (IQR) | 14.9% | 7.8% |
| Standard Deviation (Sample) | 13.6% | 7.6% |
| Standard Deviation (Population) | 13.3% | 7.5% |
Demographics Similar to Ute and Immigrants from Uganda by Family Households with Children
In terms of family households with children, the demographic groups most similar to Ute are Immigrants from Nicaragua (28.2%, a difference of 0.020%), Chilean (28.1%, a difference of 0.060%), Immigrants from Colombia (28.2%, a difference of 0.090%), Immigrants from Kenya (28.1%, a difference of 0.10%), and Immigrants from the Azores (28.1%, a difference of 0.11%). Similarly, the demographic groups most similar to Immigrants from Uganda are Immigrants from Burma/Myanmar (28.0%, a difference of 0.010%), Tohono O'odham (28.0%, a difference of 0.020%), Immigrants from South America (28.0%, a difference of 0.060%), Spaniard (28.0%, a difference of 0.060%), and Scandinavian (28.0%, a difference of 0.12%).
| Demographics | Rating | Rank | Family Households with Children |
| Immigrants | Liberia | 99.4 /100 | #91 | Exceptional 28.2% |
| Chickasaw | 99.4 /100 | #92 | Exceptional 28.2% |
| Panamanians | 99.3 /100 | #93 | Exceptional 28.2% |
| Immigrants | Colombia | 99.2 /100 | #94 | Exceptional 28.2% |
| Immigrants | Nicaragua | 99.1 /100 | #95 | Exceptional 28.2% |
| Ute | 99.1 /100 | #96 | Exceptional 28.2% |
| Chileans | 98.9 /100 | #97 | Exceptional 28.1% |
| Immigrants | Kenya | 98.9 /100 | #98 | Exceptional 28.1% |
| Immigrants | Azores | 98.8 /100 | #99 | Exceptional 28.1% |
| Indonesians | 98.8 /100 | #100 | Exceptional 28.1% |
| Immigrants | Oceania | 98.8 /100 | #101 | Exceptional 28.1% |
| Assyrians/Chaldeans/Syriacs | 98.7 /100 | #102 | Exceptional 28.1% |
| Palestinians | 98.5 /100 | #103 | Exceptional 28.1% |
| Sioux | 98.3 /100 | #104 | Exceptional 28.1% |
| Choctaw | 98.3 /100 | #105 | Exceptional 28.1% |
| Immigrants | South America | 98.0 /100 | #106 | Exceptional 28.0% |
| Immigrants | Uganda | 97.7 /100 | #107 | Exceptional 28.0% |
| Immigrants | Burma/Myanmar | 97.7 /100 | #108 | Exceptional 28.0% |
| Tohono O'odham | 97.6 /100 | #109 | Exceptional 28.0% |
| Spaniards | 97.4 /100 | #110 | Exceptional 28.0% |
| Scandinavians | 97.1 /100 | #111 | Exceptional 28.0% |