Ute vs Immigrants from Uganda Female Unemployment
COMPARE
Ute
Immigrants from Uganda
Female Unemployment
Female Unemployment Comparison
Ute
Immigrants from Uganda
6.1%
FEMALE UNEMPLOYMENT
0.0/ 100
METRIC RATING
299th/ 347
METRIC RANK
5.3%
FEMALE UNEMPLOYMENT
50.7/ 100
METRIC RATING
172nd/ 347
METRIC RANK
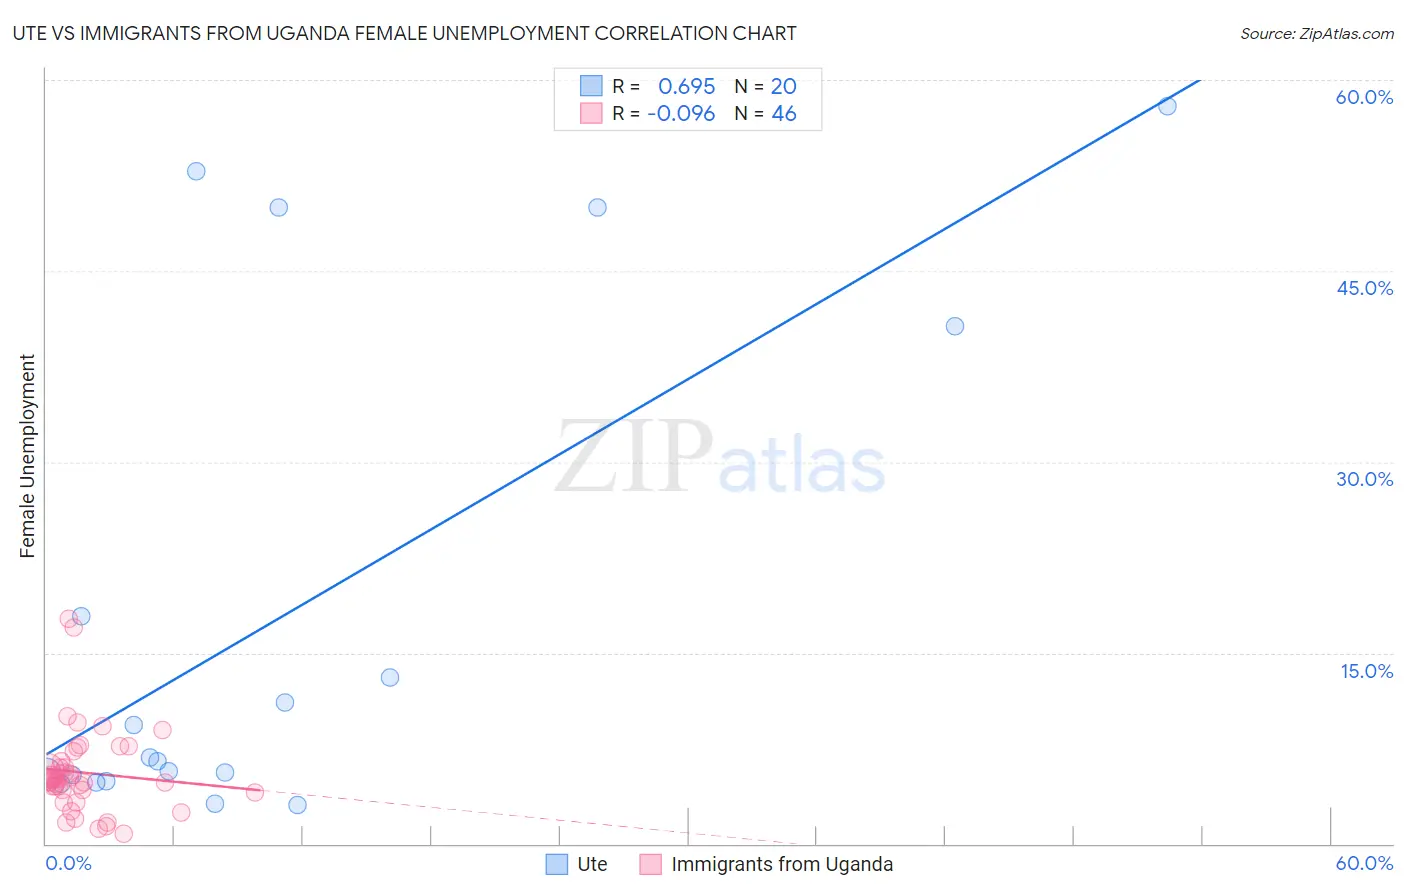
Ute vs Immigrants from Uganda Female Unemployment Correlation Chart
The statistical analysis conducted on geographies consisting of 55,567,936 people shows a significant positive correlation between the proportion of Ute and unemploymnet rate among females in the United States with a correlation coefficient (R) of 0.695 and weighted average of 6.1%. Similarly, the statistical analysis conducted on geographies consisting of 125,901,956 people shows a slight negative correlation between the proportion of Immigrants from Uganda and unemploymnet rate among females in the United States with a correlation coefficient (R) of -0.096 and weighted average of 5.3%, a difference of 16.6%.
Female Unemployment Correlation Summary
| Measurement | Ute | Immigrants from Uganda |
| Minimum | 3.0% | 0.80% |
| Maximum | 57.9% | 17.7% |
| Range | 54.9% | 16.9% |
| Mean | 17.9% | 5.6% |
| Median | 6.6% | 5.1% |
| Interquartile 25% (IQ1) | 5.1% | 4.2% |
| Interquartile 75% (IQ3) | 29.3% | 6.5% |
| Interquartile Range (IQR) | 24.1% | 2.3% |
| Standard Deviation (Sample) | 19.7% | 3.4% |
| Standard Deviation (Population) | 19.2% | 3.3% |
Similar Demographics by Female Unemployment
Demographics Similar to Ute by Female Unemployment
In terms of female unemployment, the demographic groups most similar to Ute are Immigrants from Haiti (6.1%, a difference of 0.040%), Jamaican (6.1%, a difference of 0.10%), Alaskan Athabascan (6.1%, a difference of 0.13%), West Indian (6.1%, a difference of 0.13%), and Immigrants from Latin America (6.1%, a difference of 0.16%).
| Demographics | Rating | Rank | Female Unemployment |
| Immigrants | Trinidad and Tobago | 0.0 /100 | #292 | Tragic 6.1% |
| Mexicans | 0.0 /100 | #293 | Tragic 6.1% |
| Immigrants | El Salvador | 0.0 /100 | #294 | Tragic 6.1% |
| Immigrants | Latin America | 0.0 /100 | #295 | Tragic 6.1% |
| Alaskan Athabascans | 0.0 /100 | #296 | Tragic 6.1% |
| West Indians | 0.0 /100 | #297 | Tragic 6.1% |
| Jamaicans | 0.0 /100 | #298 | Tragic 6.1% |
| Ute | 0.0 /100 | #299 | Tragic 6.1% |
| Immigrants | Haiti | 0.0 /100 | #300 | Tragic 6.1% |
| Immigrants | Barbados | 0.0 /100 | #301 | Tragic 6.2% |
| U.S. Virgin Islanders | 0.0 /100 | #302 | Tragic 6.2% |
| Barbadians | 0.0 /100 | #303 | Tragic 6.2% |
| Immigrants | Jamaica | 0.0 /100 | #304 | Tragic 6.2% |
| Spanish American Indians | 0.0 /100 | #305 | Tragic 6.2% |
| Immigrants | Central America | 0.0 /100 | #306 | Tragic 6.2% |
Demographics Similar to Immigrants from Uganda by Female Unemployment
In terms of female unemployment, the demographic groups most similar to Immigrants from Uganda are Iranian (5.3%, a difference of 0.020%), Immigrants from Poland (5.3%, a difference of 0.040%), Immigrants from Laos (5.3%, a difference of 0.19%), Immigrants from Vietnam (5.3%, a difference of 0.19%), and Immigrants from Morocco (5.3%, a difference of 0.20%).
| Demographics | Rating | Rank | Female Unemployment |
| Syrians | 62.8 /100 | #165 | Good 5.2% |
| Native Hawaiians | 62.7 /100 | #166 | Good 5.2% |
| Immigrants | Thailand | 62.1 /100 | #167 | Good 5.2% |
| Sri Lankans | 59.4 /100 | #168 | Average 5.2% |
| Immigrants | Chile | 59.0 /100 | #169 | Average 5.2% |
| Spanish | 55.9 /100 | #170 | Average 5.2% |
| Immigrants | Denmark | 55.0 /100 | #171 | Average 5.2% |
| Immigrants | Uganda | 50.7 /100 | #172 | Average 5.3% |
| Iranians | 50.4 /100 | #173 | Average 5.3% |
| Immigrants | Poland | 50.0 /100 | #174 | Average 5.3% |
| Immigrants | Laos | 47.5 /100 | #175 | Average 5.3% |
| Immigrants | Vietnam | 47.5 /100 | #176 | Average 5.3% |
| Immigrants | Morocco | 47.4 /100 | #177 | Average 5.3% |
| Immigrants | Southern Europe | 46.2 /100 | #178 | Average 5.3% |
| Laotians | 45.1 /100 | #179 | Average 5.3% |