Turkish vs Immigrants from Cameroon Family Households
COMPARE
Turkish
Immigrants from Cameroon
Family Households
Family Households Comparison
Turks
Immigrants from Cameroon
63.6%
FAMILY HOUSEHOLDS
4.5/ 100
METRIC RATING
224th/ 347
METRIC RANK
64.7%
FAMILY HOUSEHOLDS
84.8/ 100
METRIC RATING
141st/ 347
METRIC RANK
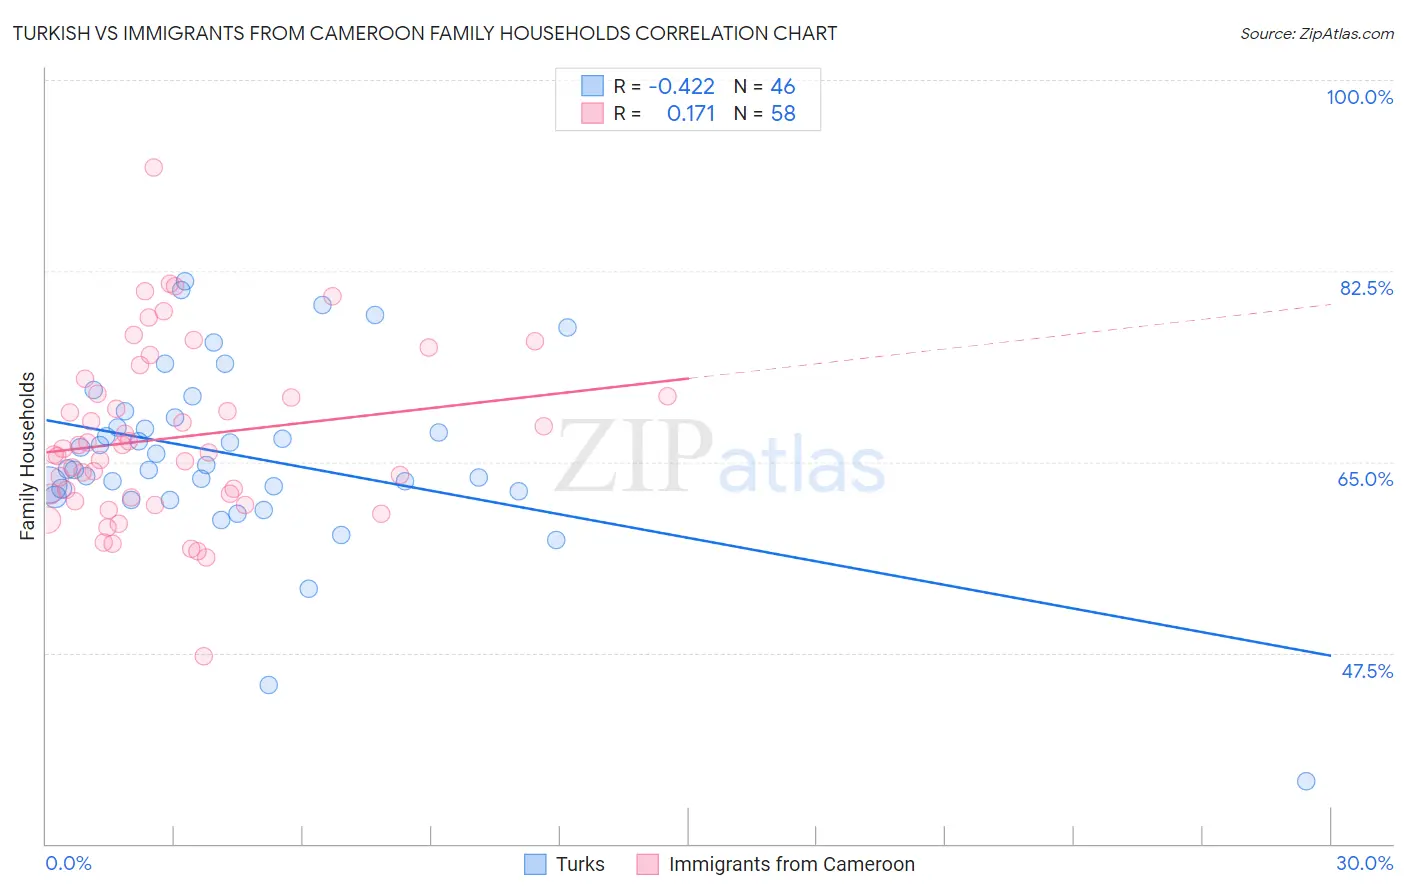
Turkish vs Immigrants from Cameroon Family Households Correlation Chart
The statistical analysis conducted on geographies consisting of 271,710,288 people shows a moderate negative correlation between the proportion of Turks and percentage of family households in the United States with a correlation coefficient (R) of -0.422 and weighted average of 63.6%. Similarly, the statistical analysis conducted on geographies consisting of 130,734,594 people shows a poor positive correlation between the proportion of Immigrants from Cameroon and percentage of family households in the United States with a correlation coefficient (R) of 0.171 and weighted average of 64.7%, a difference of 1.6%.
Family Households Correlation Summary
| Measurement | Turkish | Immigrants from Cameroon |
| Minimum | 35.7% | 47.1% |
| Maximum | 81.5% | 92.0% |
| Range | 45.8% | 44.8% |
| Mean | 65.5% | 67.2% |
| Median | 64.5% | 66.0% |
| Interquartile 25% (IQ1) | 62.3% | 61.7% |
| Interquartile 75% (IQ3) | 69.1% | 71.3% |
| Interquartile Range (IQR) | 6.8% | 9.5% |
| Standard Deviation (Sample) | 8.4% | 8.0% |
| Standard Deviation (Population) | 8.3% | 7.9% |
Similar Demographics by Family Households
Demographics Similar to Turks by Family Households
In terms of family households, the demographic groups most similar to Turks are Immigrants from Hungary (63.6%, a difference of 0.010%), Immigrants from Bahamas (63.6%, a difference of 0.020%), Trinidadian and Tobagonian (63.6%, a difference of 0.030%), Immigrants from Belarus (63.7%, a difference of 0.070%), and French Canadian (63.7%, a difference of 0.070%).
| Demographics | Rating | Rank | Family Households |
| Osage | 7.0 /100 | #217 | Tragic 63.7% |
| Marshallese | 6.9 /100 | #218 | Tragic 63.7% |
| Macedonians | 6.5 /100 | #219 | Tragic 63.7% |
| Immigrants | Europe | 6.4 /100 | #220 | Tragic 63.7% |
| Immigrants | South Africa | 5.9 /100 | #221 | Tragic 63.7% |
| Immigrants | Belarus | 5.5 /100 | #222 | Tragic 63.7% |
| French Canadians | 5.4 /100 | #223 | Tragic 63.7% |
| Turks | 4.5 /100 | #224 | Tragic 63.6% |
| Immigrants | Hungary | 4.3 /100 | #225 | Tragic 63.6% |
| Immigrants | Bahamas | 4.2 /100 | #226 | Tragic 63.6% |
| Trinidadians and Tobagonians | 4.1 /100 | #227 | Tragic 63.6% |
| Blackfeet | 3.6 /100 | #228 | Tragic 63.6% |
| Bulgarians | 3.4 /100 | #229 | Tragic 63.6% |
| Immigrants | Brazil | 3.0 /100 | #230 | Tragic 63.6% |
| Immigrants | Greece | 2.9 /100 | #231 | Tragic 63.5% |
Demographics Similar to Immigrants from Cameroon by Family Households
In terms of family households, the demographic groups most similar to Immigrants from Cameroon are Immigrants from North Macedonia (64.7%, a difference of 0.0%), Immigrants from Jamaica (64.7%, a difference of 0.010%), Basque (64.7%, a difference of 0.020%), Pakistani (64.7%, a difference of 0.020%), and Immigrants from Scotland (64.7%, a difference of 0.040%).
| Demographics | Rating | Rank | Family Households |
| Greeks | 88.1 /100 | #134 | Excellent 64.7% |
| Maltese | 87.4 /100 | #135 | Excellent 64.7% |
| Immigrants | China | 86.6 /100 | #136 | Excellent 64.7% |
| Immigrants | Scotland | 86.4 /100 | #137 | Excellent 64.7% |
| Basques | 85.5 /100 | #138 | Excellent 64.7% |
| Immigrants | Jamaica | 85.3 /100 | #139 | Excellent 64.7% |
| Immigrants | North Macedonia | 84.9 /100 | #140 | Excellent 64.7% |
| Immigrants | Cameroon | 84.8 /100 | #141 | Excellent 64.7% |
| Pakistanis | 84.0 /100 | #142 | Excellent 64.7% |
| Czechoslovakians | 82.1 /100 | #143 | Excellent 64.6% |
| South American Indians | 81.9 /100 | #144 | Excellent 64.6% |
| Welsh | 80.1 /100 | #145 | Excellent 64.6% |
| Immigrants | Romania | 77.0 /100 | #146 | Good 64.6% |
| Immigrants | Chile | 76.5 /100 | #147 | Good 64.6% |
| Delaware | 76.3 /100 | #148 | Good 64.6% |