Turkish vs Immigrants from Malaysia Family Households
COMPARE
Turkish
Immigrants from Malaysia
Family Households
Family Households Comparison
Turks
Immigrants from Malaysia
63.6%
FAMILY HOUSEHOLDS
4.5/ 100
METRIC RATING
224th/ 347
METRIC RANK
64.0%
FAMILY HOUSEHOLDS
17.9/ 100
METRIC RATING
200th/ 347
METRIC RANK
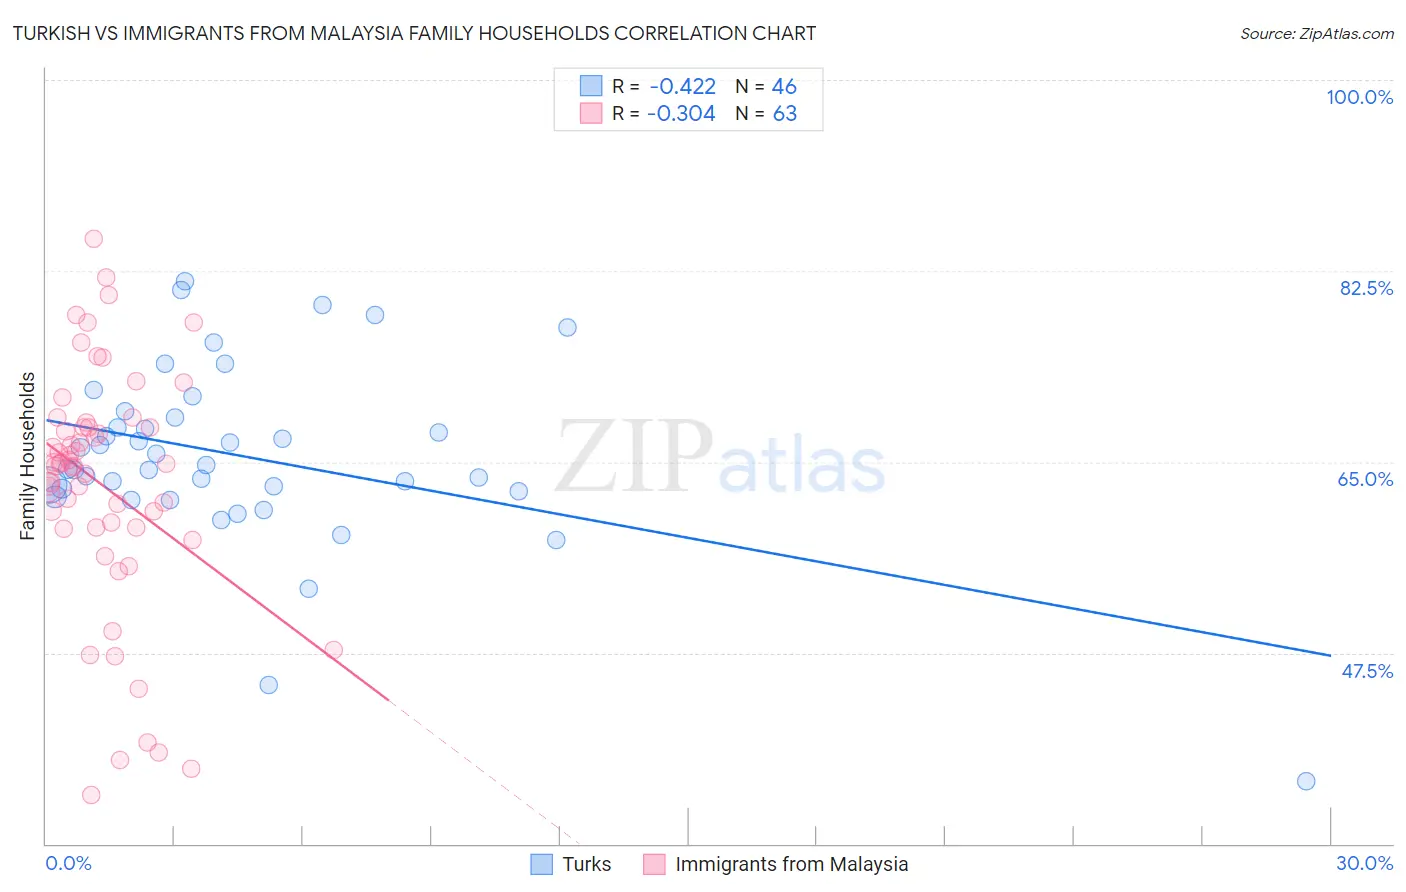
Turkish vs Immigrants from Malaysia Family Households Correlation Chart
The statistical analysis conducted on geographies consisting of 271,710,288 people shows a moderate negative correlation between the proportion of Turks and percentage of family households in the United States with a correlation coefficient (R) of -0.422 and weighted average of 63.6%. Similarly, the statistical analysis conducted on geographies consisting of 197,925,894 people shows a mild negative correlation between the proportion of Immigrants from Malaysia and percentage of family households in the United States with a correlation coefficient (R) of -0.304 and weighted average of 64.0%, a difference of 0.52%.
Family Households Correlation Summary
| Measurement | Turkish | Immigrants from Malaysia |
| Minimum | 35.7% | 34.5% |
| Maximum | 81.5% | 85.4% |
| Range | 45.8% | 50.9% |
| Mean | 65.5% | 62.8% |
| Median | 64.5% | 64.8% |
| Interquartile 25% (IQ1) | 62.3% | 59.0% |
| Interquartile 75% (IQ3) | 69.1% | 68.2% |
| Interquartile Range (IQR) | 6.8% | 9.2% |
| Standard Deviation (Sample) | 8.4% | 11.1% |
| Standard Deviation (Population) | 8.3% | 11.0% |
Similar Demographics by Family Households
Demographics Similar to Turks by Family Households
In terms of family households, the demographic groups most similar to Turks are Immigrants from Hungary (63.6%, a difference of 0.010%), Immigrants from Bahamas (63.6%, a difference of 0.020%), Trinidadian and Tobagonian (63.6%, a difference of 0.030%), Immigrants from Belarus (63.7%, a difference of 0.070%), and French Canadian (63.7%, a difference of 0.070%).
| Demographics | Rating | Rank | Family Households |
| Osage | 7.0 /100 | #217 | Tragic 63.7% |
| Marshallese | 6.9 /100 | #218 | Tragic 63.7% |
| Macedonians | 6.5 /100 | #219 | Tragic 63.7% |
| Immigrants | Europe | 6.4 /100 | #220 | Tragic 63.7% |
| Immigrants | South Africa | 5.9 /100 | #221 | Tragic 63.7% |
| Immigrants | Belarus | 5.5 /100 | #222 | Tragic 63.7% |
| French Canadians | 5.4 /100 | #223 | Tragic 63.7% |
| Turks | 4.5 /100 | #224 | Tragic 63.6% |
| Immigrants | Hungary | 4.3 /100 | #225 | Tragic 63.6% |
| Immigrants | Bahamas | 4.2 /100 | #226 | Tragic 63.6% |
| Trinidadians and Tobagonians | 4.1 /100 | #227 | Tragic 63.6% |
| Blackfeet | 3.6 /100 | #228 | Tragic 63.6% |
| Bulgarians | 3.4 /100 | #229 | Tragic 63.6% |
| Immigrants | Brazil | 3.0 /100 | #230 | Tragic 63.6% |
| Immigrants | Greece | 2.9 /100 | #231 | Tragic 63.5% |
Demographics Similar to Immigrants from Malaysia by Family Households
In terms of family households, the demographic groups most similar to Immigrants from Malaysia are Seminole (64.0%, a difference of 0.020%), Polish (64.0%, a difference of 0.020%), Slavic (64.0%, a difference of 0.020%), Immigrants from Eastern Europe (64.0%, a difference of 0.020%), and Immigrants from Canada (64.0%, a difference of 0.030%).
| Demographics | Rating | Rank | Family Households |
| French | 23.7 /100 | #193 | Fair 64.0% |
| Paiute | 22.2 /100 | #194 | Fair 64.0% |
| Immigrants | North America | 20.0 /100 | #195 | Poor 64.0% |
| Immigrants | Canada | 19.2 /100 | #196 | Poor 64.0% |
| Seminole | 18.9 /100 | #197 | Poor 64.0% |
| Poles | 18.9 /100 | #198 | Poor 64.0% |
| Slavs | 18.6 /100 | #199 | Poor 64.0% |
| Immigrants | Malaysia | 17.9 /100 | #200 | Poor 64.0% |
| Immigrants | Eastern Europe | 17.2 /100 | #201 | Poor 64.0% |
| Iranians | 13.5 /100 | #202 | Poor 63.9% |
| Norwegians | 13.2 /100 | #203 | Poor 63.9% |
| Immigrants | Uruguay | 12.8 /100 | #204 | Poor 63.9% |
| Brazilians | 12.4 /100 | #205 | Poor 63.9% |
| Immigrants | Lithuania | 12.1 /100 | #206 | Poor 63.9% |
| Nigerians | 11.5 /100 | #207 | Poor 63.9% |