Turkish vs Czechoslovakian Married-couple Households
COMPARE
Turkish
Czechoslovakian
Married-couple Households
Married-couple Households Comparison
Turks
Czechoslovakians
47.8%
MARRIED-COUPLE HOUSEHOLDS
96.1/ 100
METRIC RATING
101st/ 347
METRIC RANK
48.5%
MARRIED-COUPLE HOUSEHOLDS
99.2/ 100
METRIC RATING
59th/ 347
METRIC RANK
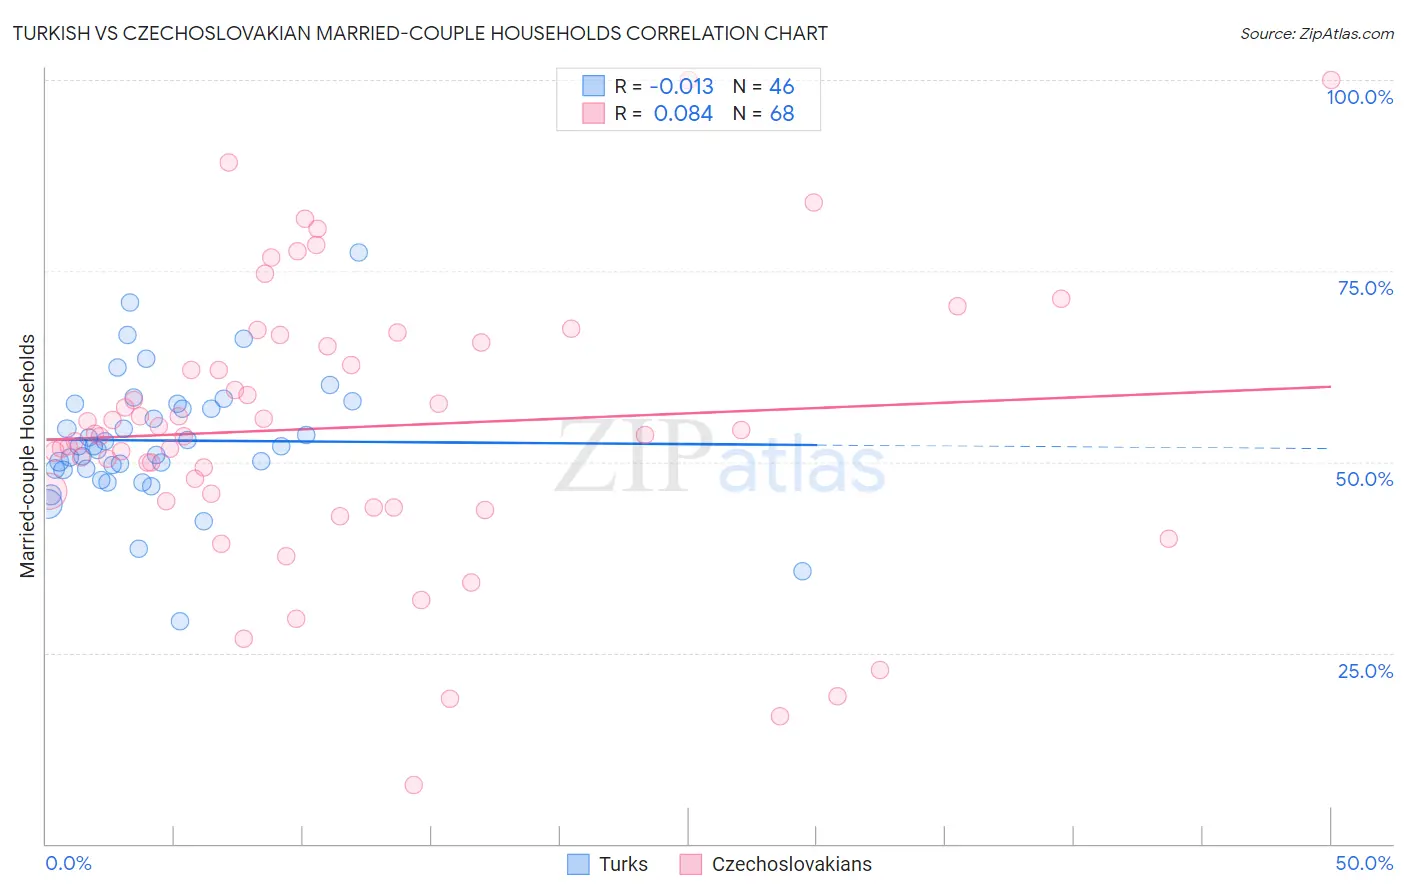
Turkish vs Czechoslovakian Married-couple Households Correlation Chart
The statistical analysis conducted on geographies consisting of 271,700,088 people shows no correlation between the proportion of Turks and percentage of married-couple family households in the United States with a correlation coefficient (R) of -0.013 and weighted average of 47.8%. Similarly, the statistical analysis conducted on geographies consisting of 368,521,204 people shows a slight positive correlation between the proportion of Czechoslovakians and percentage of married-couple family households in the United States with a correlation coefficient (R) of 0.084 and weighted average of 48.5%, a difference of 1.5%.
Married-couple Households Correlation Summary
| Measurement | Turkish | Czechoslovakian |
| Minimum | 29.1% | 7.6% |
| Maximum | 77.4% | 100.0% |
| Range | 48.3% | 92.4% |
| Mean | 52.8% | 54.5% |
| Median | 52.0% | 53.6% |
| Interquartile 25% (IQ1) | 49.0% | 45.3% |
| Interquartile 75% (IQ3) | 57.6% | 65.4% |
| Interquartile Range (IQR) | 8.5% | 20.1% |
| Standard Deviation (Sample) | 8.5% | 18.3% |
| Standard Deviation (Population) | 8.4% | 18.1% |
Similar Demographics by Married-couple Households
Demographics Similar to Turks by Married-couple Households
In terms of married-couple households, the demographic groups most similar to Turks are Slavic (47.8%, a difference of 0.020%), Hawaiian (47.8%, a difference of 0.020%), Immigrants from South Africa (47.8%, a difference of 0.030%), Immigrants from Italy (47.9%, a difference of 0.060%), and Immigrants from Austria (47.9%, a difference of 0.070%).
| Demographics | Rating | Rank | Married-couple Households |
| Americans | 96.9 /100 | #94 | Exceptional 47.9% |
| Immigrants | Belgium | 96.8 /100 | #95 | Exceptional 47.9% |
| Immigrants | Egypt | 96.6 /100 | #96 | Exceptional 47.9% |
| Latvians | 96.5 /100 | #97 | Exceptional 47.9% |
| Immigrants | North Macedonia | 96.4 /100 | #98 | Exceptional 47.9% |
| Immigrants | Austria | 96.4 /100 | #99 | Exceptional 47.9% |
| Immigrants | Italy | 96.3 /100 | #100 | Exceptional 47.9% |
| Turks | 96.1 /100 | #101 | Exceptional 47.8% |
| Slavs | 96.0 /100 | #102 | Exceptional 47.8% |
| Hawaiians | 96.0 /100 | #103 | Exceptional 47.8% |
| Immigrants | South Africa | 96.0 /100 | #104 | Exceptional 47.8% |
| Immigrants | Czechoslovakia | 95.5 /100 | #105 | Exceptional 47.8% |
| Portuguese | 95.5 /100 | #106 | Exceptional 47.8% |
| Estonians | 94.7 /100 | #107 | Exceptional 47.7% |
| Immigrants | Japan | 94.4 /100 | #108 | Exceptional 47.7% |
Demographics Similar to Czechoslovakians by Married-couple Households
In terms of married-couple households, the demographic groups most similar to Czechoslovakians are Immigrants from Indonesia (48.5%, a difference of 0.0%), Polish (48.5%, a difference of 0.010%), Croatian (48.5%, a difference of 0.080%), Austrian (48.6%, a difference of 0.090%), and Immigrants from Northern Europe (48.6%, a difference of 0.090%).
| Demographics | Rating | Rank | Married-couple Households |
| Irish | 99.3 /100 | #52 | Exceptional 48.6% |
| Whites/Caucasians | 99.3 /100 | #53 | Exceptional 48.6% |
| Immigrants | Lithuania | 99.3 /100 | #54 | Exceptional 48.6% |
| Austrians | 99.3 /100 | #55 | Exceptional 48.6% |
| Immigrants | Northern Europe | 99.3 /100 | #56 | Exceptional 48.6% |
| Poles | 99.2 /100 | #57 | Exceptional 48.5% |
| Immigrants | Indonesia | 99.2 /100 | #58 | Exceptional 48.5% |
| Czechoslovakians | 99.2 /100 | #59 | Exceptional 48.5% |
| Croatians | 99.1 /100 | #60 | Exceptional 48.5% |
| Bulgarians | 99.1 /100 | #61 | Exceptional 48.5% |
| Luxembourgers | 99.1 /100 | #62 | Exceptional 48.5% |
| Basques | 99.0 /100 | #63 | Exceptional 48.4% |
| Northern Europeans | 99.0 /100 | #64 | Exceptional 48.4% |
| Immigrants | Canada | 99.0 /100 | #65 | Exceptional 48.4% |
| Jordanians | 98.9 /100 | #66 | Exceptional 48.4% |