Turkish vs German Russian Married-couple Households
COMPARE
Turkish
German Russian
Married-couple Households
Married-couple Households Comparison
Turks
German Russians
47.8%
MARRIED-COUPLE HOUSEHOLDS
96.1/ 100
METRIC RATING
101st/ 347
METRIC RANK
44.0%
MARRIED-COUPLE HOUSEHOLDS
0.4/ 100
METRIC RATING
251st/ 347
METRIC RANK
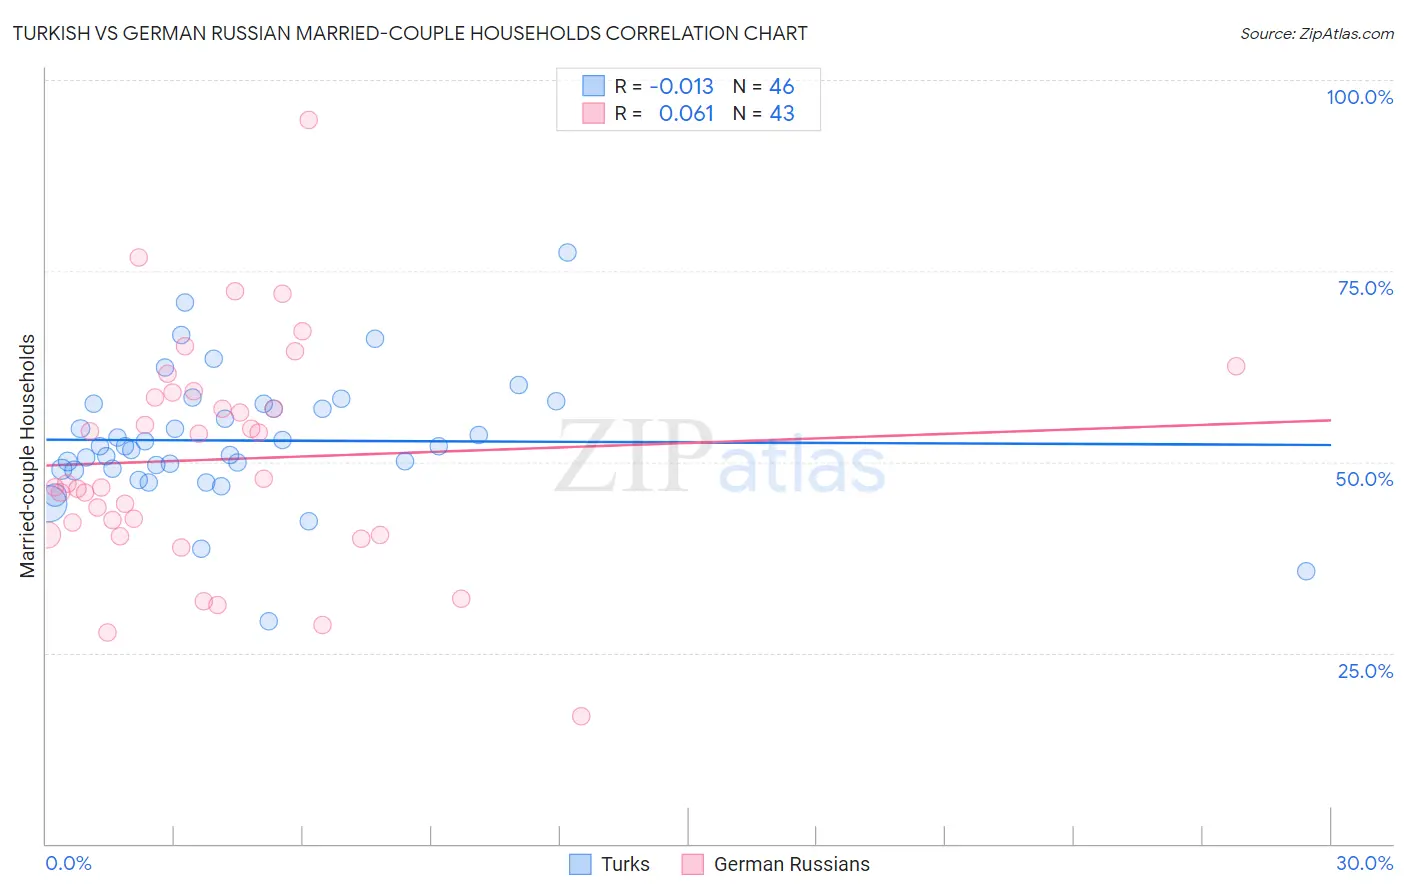
Turkish vs German Russian Married-couple Households Correlation Chart
The statistical analysis conducted on geographies consisting of 271,700,088 people shows no correlation between the proportion of Turks and percentage of married-couple family households in the United States with a correlation coefficient (R) of -0.013 and weighted average of 47.8%. Similarly, the statistical analysis conducted on geographies consisting of 96,451,375 people shows a slight positive correlation between the proportion of German Russians and percentage of married-couple family households in the United States with a correlation coefficient (R) of 0.061 and weighted average of 44.0%, a difference of 8.7%.
Married-couple Households Correlation Summary
| Measurement | Turkish | German Russian |
| Minimum | 29.1% | 16.7% |
| Maximum | 77.4% | 94.7% |
| Range | 48.3% | 78.1% |
| Mean | 52.8% | 50.3% |
| Median | 52.0% | 47.1% |
| Interquartile 25% (IQ1) | 49.0% | 40.4% |
| Interquartile 75% (IQ3) | 57.6% | 59.0% |
| Interquartile Range (IQR) | 8.5% | 18.6% |
| Standard Deviation (Sample) | 8.5% | 14.7% |
| Standard Deviation (Population) | 8.4% | 14.5% |
Similar Demographics by Married-couple Households
Demographics Similar to Turks by Married-couple Households
In terms of married-couple households, the demographic groups most similar to Turks are Slavic (47.8%, a difference of 0.020%), Hawaiian (47.8%, a difference of 0.020%), Immigrants from South Africa (47.8%, a difference of 0.030%), Immigrants from Italy (47.9%, a difference of 0.060%), and Immigrants from Austria (47.9%, a difference of 0.070%).
| Demographics | Rating | Rank | Married-couple Households |
| Americans | 96.9 /100 | #94 | Exceptional 47.9% |
| Immigrants | Belgium | 96.8 /100 | #95 | Exceptional 47.9% |
| Immigrants | Egypt | 96.6 /100 | #96 | Exceptional 47.9% |
| Latvians | 96.5 /100 | #97 | Exceptional 47.9% |
| Immigrants | North Macedonia | 96.4 /100 | #98 | Exceptional 47.9% |
| Immigrants | Austria | 96.4 /100 | #99 | Exceptional 47.9% |
| Immigrants | Italy | 96.3 /100 | #100 | Exceptional 47.9% |
| Turks | 96.1 /100 | #101 | Exceptional 47.8% |
| Slavs | 96.0 /100 | #102 | Exceptional 47.8% |
| Hawaiians | 96.0 /100 | #103 | Exceptional 47.8% |
| Immigrants | South Africa | 96.0 /100 | #104 | Exceptional 47.8% |
| Immigrants | Czechoslovakia | 95.5 /100 | #105 | Exceptional 47.8% |
| Portuguese | 95.5 /100 | #106 | Exceptional 47.8% |
| Estonians | 94.7 /100 | #107 | Exceptional 47.7% |
| Immigrants | Japan | 94.4 /100 | #108 | Exceptional 47.7% |
Demographics Similar to German Russians by Married-couple Households
In terms of married-couple households, the demographic groups most similar to German Russians are Seminole (44.0%, a difference of 0.070%), French American Indian (44.1%, a difference of 0.080%), Immigrants from Kenya (44.1%, a difference of 0.090%), Yup'ik (44.1%, a difference of 0.14%), and Central American (43.9%, a difference of 0.19%).
| Demographics | Rating | Rank | Married-couple Households |
| Immigrants | Armenia | 0.7 /100 | #244 | Tragic 44.3% |
| Immigrants | El Salvador | 0.7 /100 | #245 | Tragic 44.3% |
| Immigrants | Cuba | 0.6 /100 | #246 | Tragic 44.2% |
| Immigrants | Morocco | 0.6 /100 | #247 | Tragic 44.2% |
| Yup'ik | 0.4 /100 | #248 | Tragic 44.1% |
| Immigrants | Kenya | 0.4 /100 | #249 | Tragic 44.1% |
| French American Indians | 0.4 /100 | #250 | Tragic 44.1% |
| German Russians | 0.4 /100 | #251 | Tragic 44.0% |
| Seminole | 0.4 /100 | #252 | Tragic 44.0% |
| Central Americans | 0.3 /100 | #253 | Tragic 43.9% |
| Apache | 0.3 /100 | #254 | Tragic 43.9% |
| Shoshone | 0.3 /100 | #255 | Tragic 43.9% |
| Ugandans | 0.3 /100 | #256 | Tragic 43.8% |
| Blackfeet | 0.2 /100 | #257 | Tragic 43.8% |
| Central American Indians | 0.2 /100 | #258 | Tragic 43.8% |