Spanish vs Immigrants from Senegal Births to Unmarried Women
COMPARE
Spanish
Immigrants from Senegal
Births to Unmarried Women
Births to Unmarried Women Comparison
Spanish
Immigrants from Senegal
34.1%
BIRTHS TO UNMARRIED WOMEN
4.0/ 100
METRIC RATING
225th/ 347
METRIC RANK
36.7%
BIRTHS TO UNMARRIED WOMEN
0.1/ 100
METRIC RATING
266th/ 347
METRIC RANK
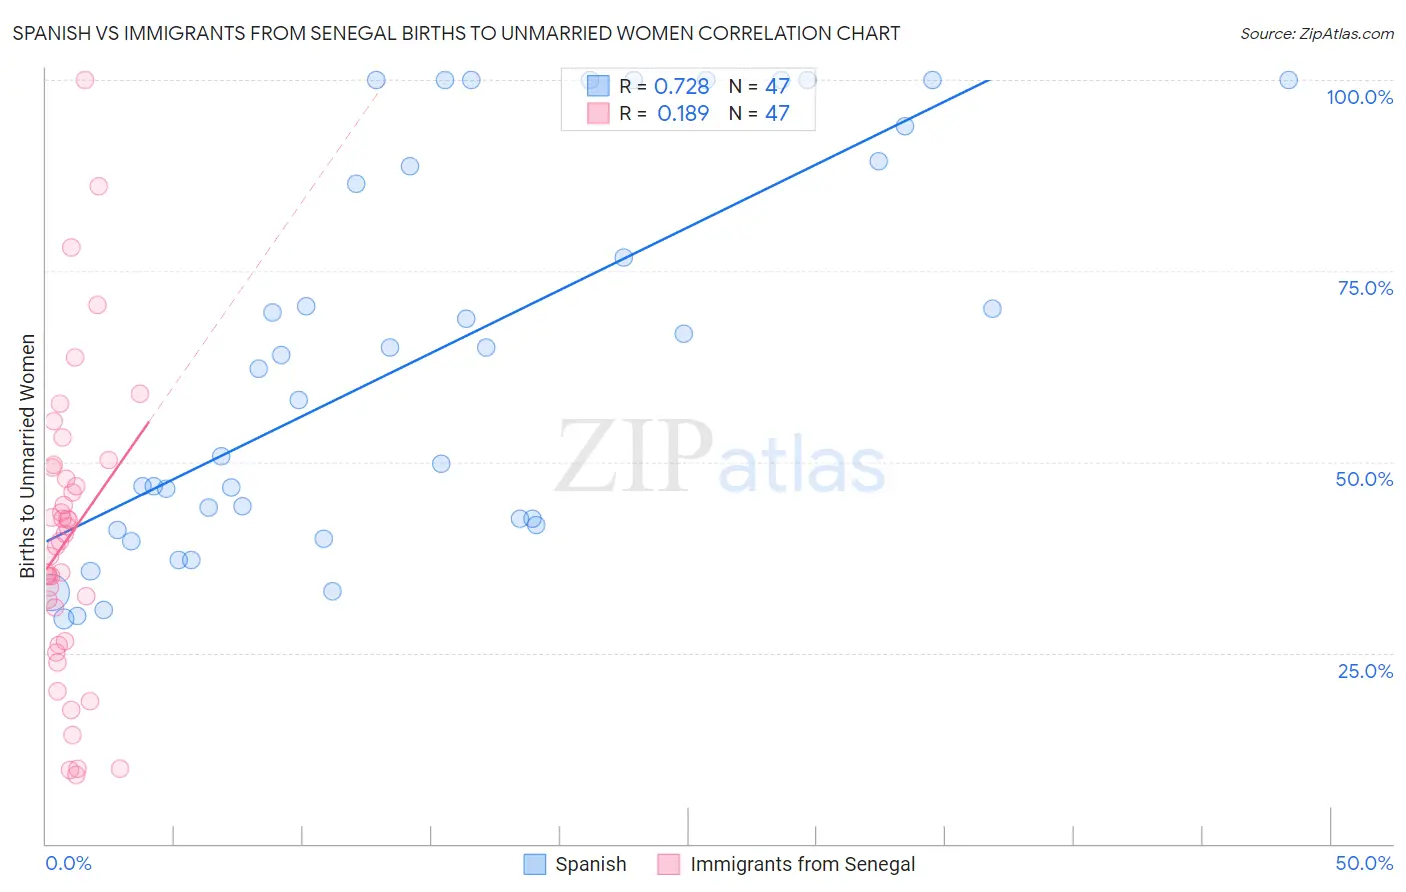
Spanish vs Immigrants from Senegal Births to Unmarried Women Correlation Chart
The statistical analysis conducted on geographies consisting of 393,000,764 people shows a strong positive correlation between the proportion of Spanish and percentage of births to unmarried women in the United States with a correlation coefficient (R) of 0.728 and weighted average of 34.1%. Similarly, the statistical analysis conducted on geographies consisting of 88,702,422 people shows a poor positive correlation between the proportion of Immigrants from Senegal and percentage of births to unmarried women in the United States with a correlation coefficient (R) of 0.189 and weighted average of 36.7%, a difference of 7.7%.
Births to Unmarried Women Correlation Summary
| Measurement | Spanish | Immigrants from Senegal |
| Minimum | 29.5% | 9.0% |
| Maximum | 100.0% | 100.0% |
| Range | 70.5% | 91.0% |
| Mean | 63.5% | 40.1% |
| Median | 62.2% | 39.5% |
| Interquartile 25% (IQ1) | 41.7% | 26.5% |
| Interquartile 75% (IQ3) | 89.4% | 49.2% |
| Interquartile Range (IQR) | 47.7% | 22.8% |
| Standard Deviation (Sample) | 25.1% | 19.3% |
| Standard Deviation (Population) | 24.9% | 19.1% |
Similar Demographics by Births to Unmarried Women
Demographics Similar to Spanish by Births to Unmarried Women
In terms of births to unmarried women, the demographic groups most similar to Spanish are Immigrants from Laos (34.0%, a difference of 0.16%), Pennsylvania German (34.0%, a difference of 0.17%), Delaware (34.2%, a difference of 0.39%), Immigrants from Panama (34.2%, a difference of 0.41%), and Panamanian (34.2%, a difference of 0.44%).
| Demographics | Rating | Rank | Births to Unmarried Women |
| Immigrants | Ecuador | 5.9 /100 | #218 | Tragic 33.7% |
| Alsatians | 5.4 /100 | #219 | Tragic 33.8% |
| Portuguese | 5.4 /100 | #220 | Tragic 33.8% |
| Malaysians | 5.0 /100 | #221 | Tragic 33.9% |
| Immigrants | Uruguay | 4.8 /100 | #222 | Tragic 33.9% |
| Pennsylvania Germans | 4.3 /100 | #223 | Tragic 34.0% |
| Immigrants | Laos | 4.3 /100 | #224 | Tragic 34.0% |
| Spanish | 4.0 /100 | #225 | Tragic 34.1% |
| Delaware | 3.3 /100 | #226 | Tragic 34.2% |
| Immigrants | Panama | 3.3 /100 | #227 | Tragic 34.2% |
| Panamanians | 3.3 /100 | #228 | Tragic 34.2% |
| Immigrants | Sierra Leone | 3.1 /100 | #229 | Tragic 34.2% |
| Ghanaians | 3.1 /100 | #230 | Tragic 34.3% |
| Native Hawaiians | 2.9 /100 | #231 | Tragic 34.3% |
| French Canadians | 2.5 /100 | #232 | Tragic 34.4% |
Demographics Similar to Immigrants from Senegal by Births to Unmarried Women
In terms of births to unmarried women, the demographic groups most similar to Immigrants from Senegal are Cherokee (36.7%, a difference of 0.050%), Central American (36.7%, a difference of 0.070%), Comanche (36.7%, a difference of 0.080%), Subsaharan African (36.7%, a difference of 0.10%), and Senegalese (36.8%, a difference of 0.20%).
| Demographics | Rating | Rank | Births to Unmarried Women |
| Immigrants | El Salvador | 0.2 /100 | #259 | Tragic 36.4% |
| Ottawa | 0.2 /100 | #260 | Tragic 36.5% |
| Trinidadians and Tobagonians | 0.2 /100 | #261 | Tragic 36.5% |
| French American Indians | 0.1 /100 | #262 | Tragic 36.6% |
| Nicaraguans | 0.1 /100 | #263 | Tragic 36.6% |
| Sub-Saharan Africans | 0.1 /100 | #264 | Tragic 36.7% |
| Cherokee | 0.1 /100 | #265 | Tragic 36.7% |
| Immigrants | Senegal | 0.1 /100 | #266 | Tragic 36.7% |
| Central Americans | 0.1 /100 | #267 | Tragic 36.7% |
| Comanche | 0.1 /100 | #268 | Tragic 36.7% |
| Senegalese | 0.1 /100 | #269 | Tragic 36.8% |
| Immigrants | Congo | 0.1 /100 | #270 | Tragic 36.8% |
| Immigrants | Barbados | 0.1 /100 | #271 | Tragic 36.8% |
| Choctaw | 0.1 /100 | #272 | Tragic 36.9% |
| Mexicans | 0.1 /100 | #273 | Tragic 36.9% |