Spanish vs Immigrants from Senegal Doctorate Degree
COMPARE
Spanish
Immigrants from Senegal
Doctorate Degree
Doctorate Degree Comparison
Spanish
Immigrants from Senegal
1.8%
DOCTORATE DEGREE
49.3/ 100
METRIC RATING
176th/ 347
METRIC RANK
1.9%
DOCTORATE DEGREE
82.5/ 100
METRIC RATING
147th/ 347
METRIC RANK
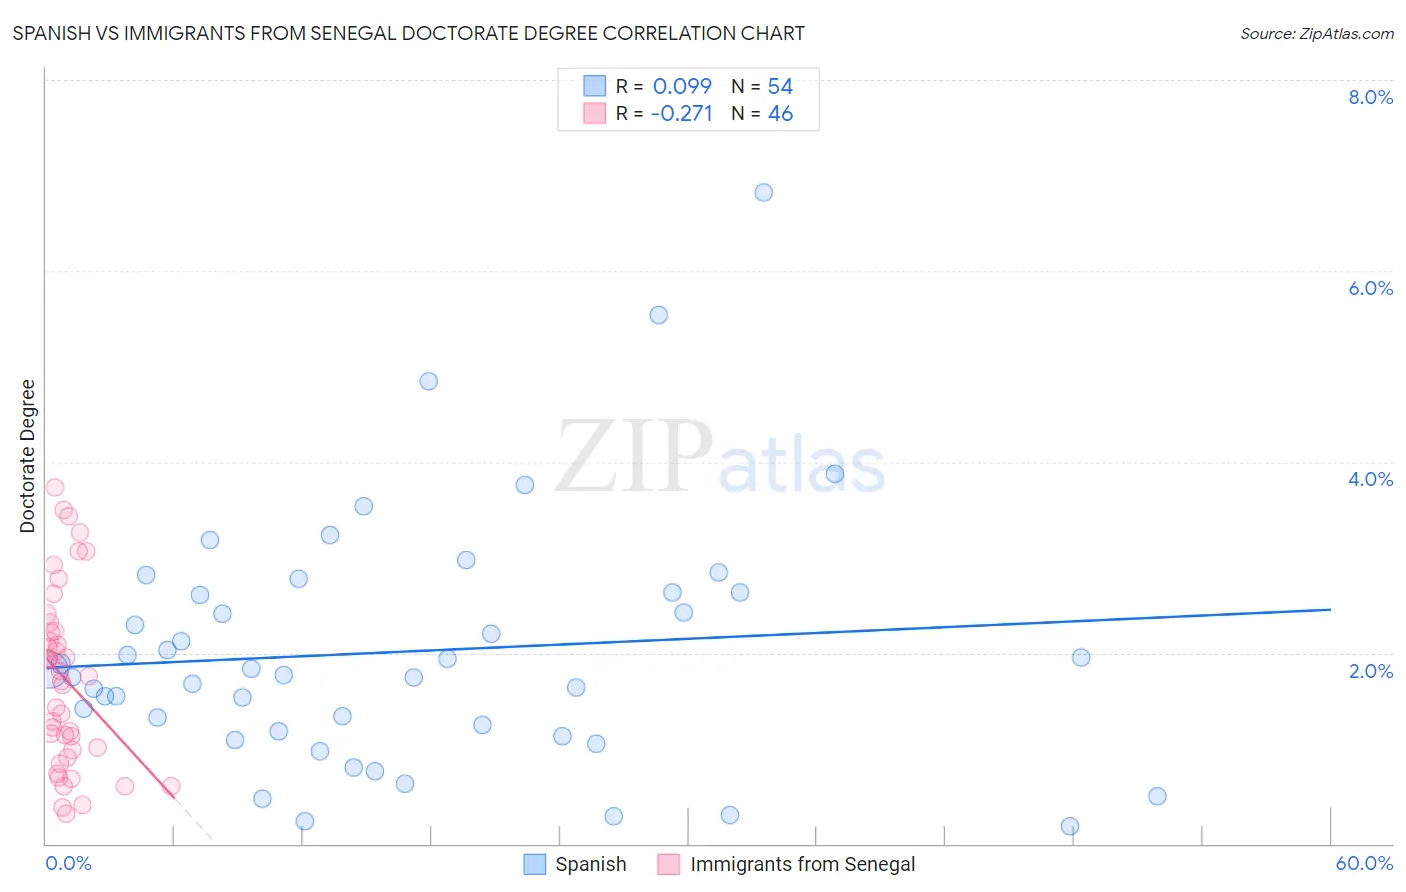
Spanish vs Immigrants from Senegal Doctorate Degree Correlation Chart
The statistical analysis conducted on geographies consisting of 416,138,041 people shows a slight positive correlation between the proportion of Spanish and percentage of population with at least doctorate degree education in the United States with a correlation coefficient (R) of 0.099 and weighted average of 1.8%. Similarly, the statistical analysis conducted on geographies consisting of 89,977,778 people shows a weak negative correlation between the proportion of Immigrants from Senegal and percentage of population with at least doctorate degree education in the United States with a correlation coefficient (R) of -0.271 and weighted average of 1.9%, a difference of 5.8%.
Doctorate Degree Correlation Summary
| Measurement | Spanish | Immigrants from Senegal |
| Minimum | 0.18% | 0.31% |
| Maximum | 6.8% | 3.7% |
| Range | 6.6% | 3.4% |
| Mean | 2.0% | 1.7% |
| Median | 1.8% | 1.7% |
| Interquartile 25% (IQ1) | 1.2% | 0.98% |
| Interquartile 75% (IQ3) | 2.6% | 2.2% |
| Interquartile Range (IQR) | 1.5% | 1.2% |
| Standard Deviation (Sample) | 1.3% | 0.92% |
| Standard Deviation (Population) | 1.3% | 0.91% |
Similar Demographics by Doctorate Degree
Demographics Similar to Spanish by Doctorate Degree
In terms of doctorate degree, the demographic groups most similar to Spanish are Iraqi (1.8%, a difference of 0.010%), Immigrants from Thailand (1.8%, a difference of 0.020%), French (1.8%, a difference of 0.070%), Norwegian (1.8%, a difference of 0.10%), and Immigrants from Bangladesh (1.8%, a difference of 0.10%).
| Demographics | Rating | Rank | Doctorate Degree |
| Vietnamese | 54.8 /100 | #169 | Average 1.9% |
| Costa Ricans | 53.3 /100 | #170 | Average 1.8% |
| Bermudans | 52.1 /100 | #171 | Average 1.8% |
| Belgians | 50.3 /100 | #172 | Average 1.8% |
| Norwegians | 50.0 /100 | #173 | Average 1.8% |
| Immigrants | Bangladesh | 50.0 /100 | #174 | Average 1.8% |
| Immigrants | Thailand | 49.4 /100 | #175 | Average 1.8% |
| Spanish | 49.3 /100 | #176 | Average 1.8% |
| Iraqis | 49.2 /100 | #177 | Average 1.8% |
| French | 48.8 /100 | #178 | Average 1.8% |
| Ghanaians | 48.3 /100 | #179 | Average 1.8% |
| Scandinavians | 48.0 /100 | #180 | Average 1.8% |
| Immigrants | Immigrants | 46.2 /100 | #181 | Average 1.8% |
| Immigrants | Afghanistan | 44.3 /100 | #182 | Average 1.8% |
| Finns | 42.1 /100 | #183 | Average 1.8% |
Demographics Similar to Immigrants from Senegal by Doctorate Degree
In terms of doctorate degree, the demographic groups most similar to Immigrants from Senegal are Immigrants from Syria (1.9%, a difference of 0.25%), Kenyan (1.9%, a difference of 0.27%), Luxembourger (1.9%, a difference of 0.33%), Immigrants from Moldova (2.0%, a difference of 0.45%), and Sierra Leonean (2.0%, a difference of 0.66%).
| Demographics | Rating | Rank | Doctorate Degree |
| Immigrants | Africa | 87.0 /100 | #140 | Excellent 2.0% |
| Senegalese | 86.7 /100 | #141 | Excellent 2.0% |
| Italians | 86.0 /100 | #142 | Excellent 2.0% |
| Sierra Leoneans | 85.1 /100 | #143 | Excellent 2.0% |
| Immigrants | Moldova | 84.3 /100 | #144 | Excellent 2.0% |
| Kenyans | 83.6 /100 | #145 | Excellent 1.9% |
| Immigrants | Syria | 83.6 /100 | #146 | Excellent 1.9% |
| Immigrants | Senegal | 82.5 /100 | #147 | Excellent 1.9% |
| Luxembourgers | 81.1 /100 | #148 | Excellent 1.9% |
| Basques | 76.9 /100 | #149 | Good 1.9% |
| English | 75.9 /100 | #150 | Good 1.9% |
| Albanians | 74.8 /100 | #151 | Good 1.9% |
| Immigrants | Kenya | 74.3 /100 | #152 | Good 1.9% |
| Immigrants | Oceania | 74.0 /100 | #153 | Good 1.9% |
| Immigrants | Albania | 72.8 /100 | #154 | Good 1.9% |