Spanish vs Immigrants from Sudan Births to Unmarried Women
COMPARE
Spanish
Immigrants from Sudan
Births to Unmarried Women
Births to Unmarried Women Comparison
Spanish
Immigrants from Sudan
34.1%
BIRTHS TO UNMARRIED WOMEN
4.0/ 100
METRIC RATING
225th/ 347
METRIC RANK
33.2%
BIRTHS TO UNMARRIED WOMEN
11.5/ 100
METRIC RATING
207th/ 347
METRIC RANK
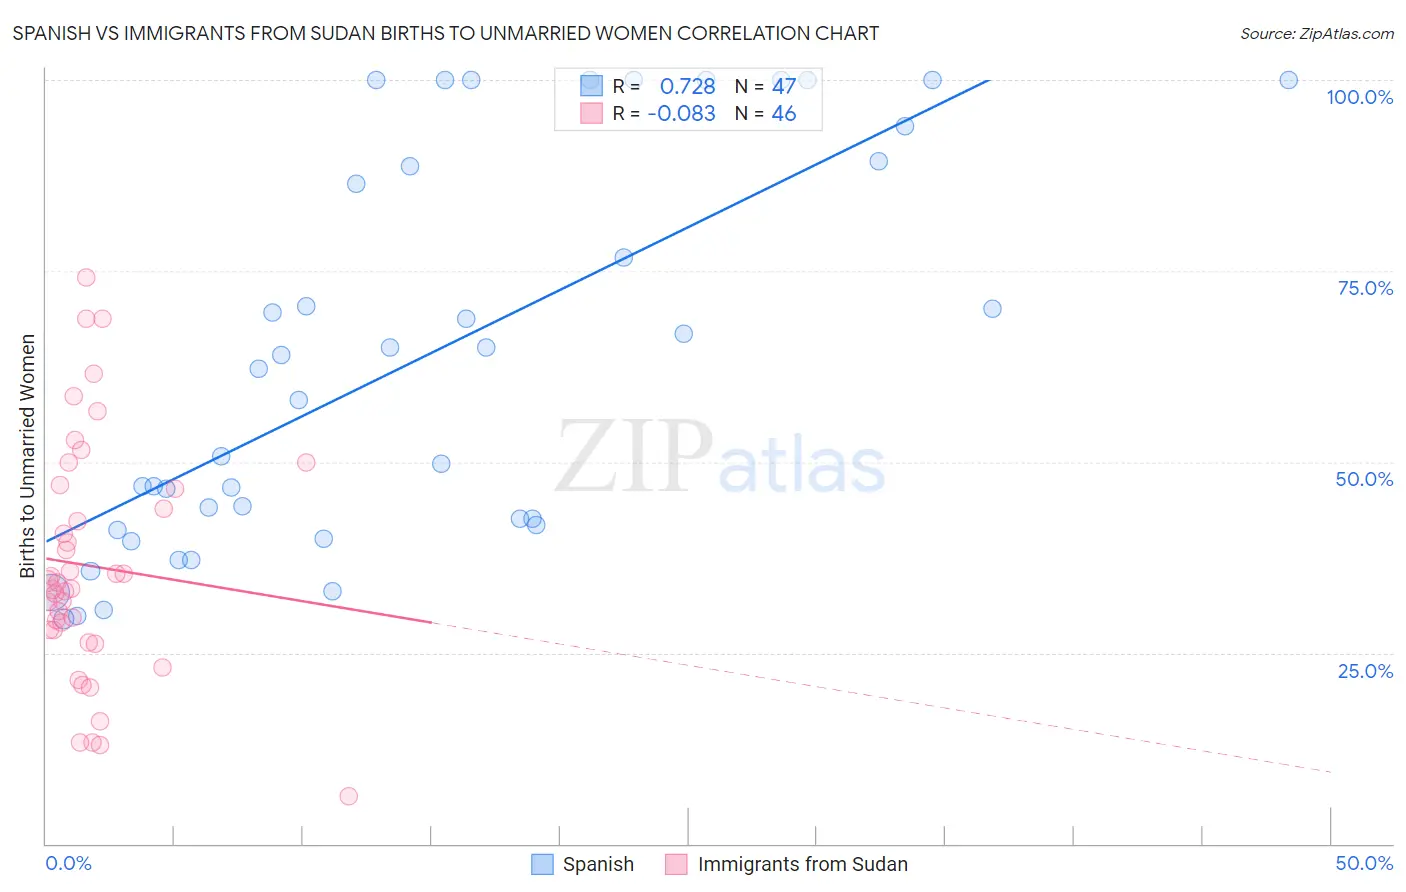
Spanish vs Immigrants from Sudan Births to Unmarried Women Correlation Chart
The statistical analysis conducted on geographies consisting of 393,000,764 people shows a strong positive correlation between the proportion of Spanish and percentage of births to unmarried women in the United States with a correlation coefficient (R) of 0.728 and weighted average of 34.1%. Similarly, the statistical analysis conducted on geographies consisting of 116,444,182 people shows a slight negative correlation between the proportion of Immigrants from Sudan and percentage of births to unmarried women in the United States with a correlation coefficient (R) of -0.083 and weighted average of 33.2%, a difference of 2.6%.
Births to Unmarried Women Correlation Summary
| Measurement | Spanish | Immigrants from Sudan |
| Minimum | 29.5% | 6.3% |
| Maximum | 100.0% | 74.2% |
| Range | 70.5% | 67.9% |
| Mean | 63.5% | 36.3% |
| Median | 62.2% | 33.8% |
| Interquartile 25% (IQ1) | 41.7% | 28.0% |
| Interquartile 75% (IQ3) | 89.4% | 46.4% |
| Interquartile Range (IQR) | 47.7% | 18.4% |
| Standard Deviation (Sample) | 25.1% | 15.4% |
| Standard Deviation (Population) | 24.9% | 15.3% |
Demographics Similar to Spanish and Immigrants from Sudan by Births to Unmarried Women
In terms of births to unmarried women, the demographic groups most similar to Spanish are Immigrants from Laos (34.0%, a difference of 0.16%), Pennsylvania German (34.0%, a difference of 0.17%), Delaware (34.2%, a difference of 0.39%), Immigrants from Uruguay (33.9%, a difference of 0.46%), and Malaysian (33.9%, a difference of 0.52%). Similarly, the demographic groups most similar to Immigrants from Sudan are Hawaiian (33.2%, a difference of 0.030%), White/Caucasian (33.3%, a difference of 0.17%), Scotch-Irish (33.3%, a difference of 0.17%), Ecuadorian (33.3%, a difference of 0.22%), and Uruguayan (33.1%, a difference of 0.29%).
| Demographics | Rating | Rank | Births to Unmarried Women |
| Uruguayans | 12.8 /100 | #206 | Poor 33.1% |
| Immigrants | Sudan | 11.5 /100 | #207 | Poor 33.2% |
| Hawaiians | 11.3 /100 | #208 | Poor 33.2% |
| Whites/Caucasians | 10.7 /100 | #209 | Poor 33.3% |
| Scotch-Irish | 10.7 /100 | #210 | Poor 33.3% |
| Ecuadorians | 10.5 /100 | #211 | Poor 33.3% |
| Celtics | 10.2 /100 | #212 | Poor 33.3% |
| Immigrants | Costa Rica | 9.5 /100 | #213 | Tragic 33.4% |
| Slovaks | 9.3 /100 | #214 | Tragic 33.4% |
| French | 8.7 /100 | #215 | Tragic 33.4% |
| Nepalese | 7.8 /100 | #216 | Tragic 33.5% |
| Spaniards | 7.0 /100 | #217 | Tragic 33.6% |
| Immigrants | Ecuador | 5.9 /100 | #218 | Tragic 33.7% |
| Alsatians | 5.4 /100 | #219 | Tragic 33.8% |
| Portuguese | 5.4 /100 | #220 | Tragic 33.8% |
| Malaysians | 5.0 /100 | #221 | Tragic 33.9% |
| Immigrants | Uruguay | 4.8 /100 | #222 | Tragic 33.9% |
| Pennsylvania Germans | 4.3 /100 | #223 | Tragic 34.0% |
| Immigrants | Laos | 4.3 /100 | #224 | Tragic 34.0% |
| Spanish | 4.0 /100 | #225 | Tragic 34.1% |
| Delaware | 3.3 /100 | #226 | Tragic 34.2% |