Serbian vs South American Indian Married-couple Households
COMPARE
Serbian
South American Indian
Married-couple Households
Married-couple Households Comparison
Serbians
South American Indians
47.0%
MARRIED-COUPLE HOUSEHOLDS
76.3/ 100
METRIC RATING
152nd/ 347
METRIC RANK
46.0%
MARRIED-COUPLE HOUSEHOLDS
28.4/ 100
METRIC RATING
188th/ 347
METRIC RANK
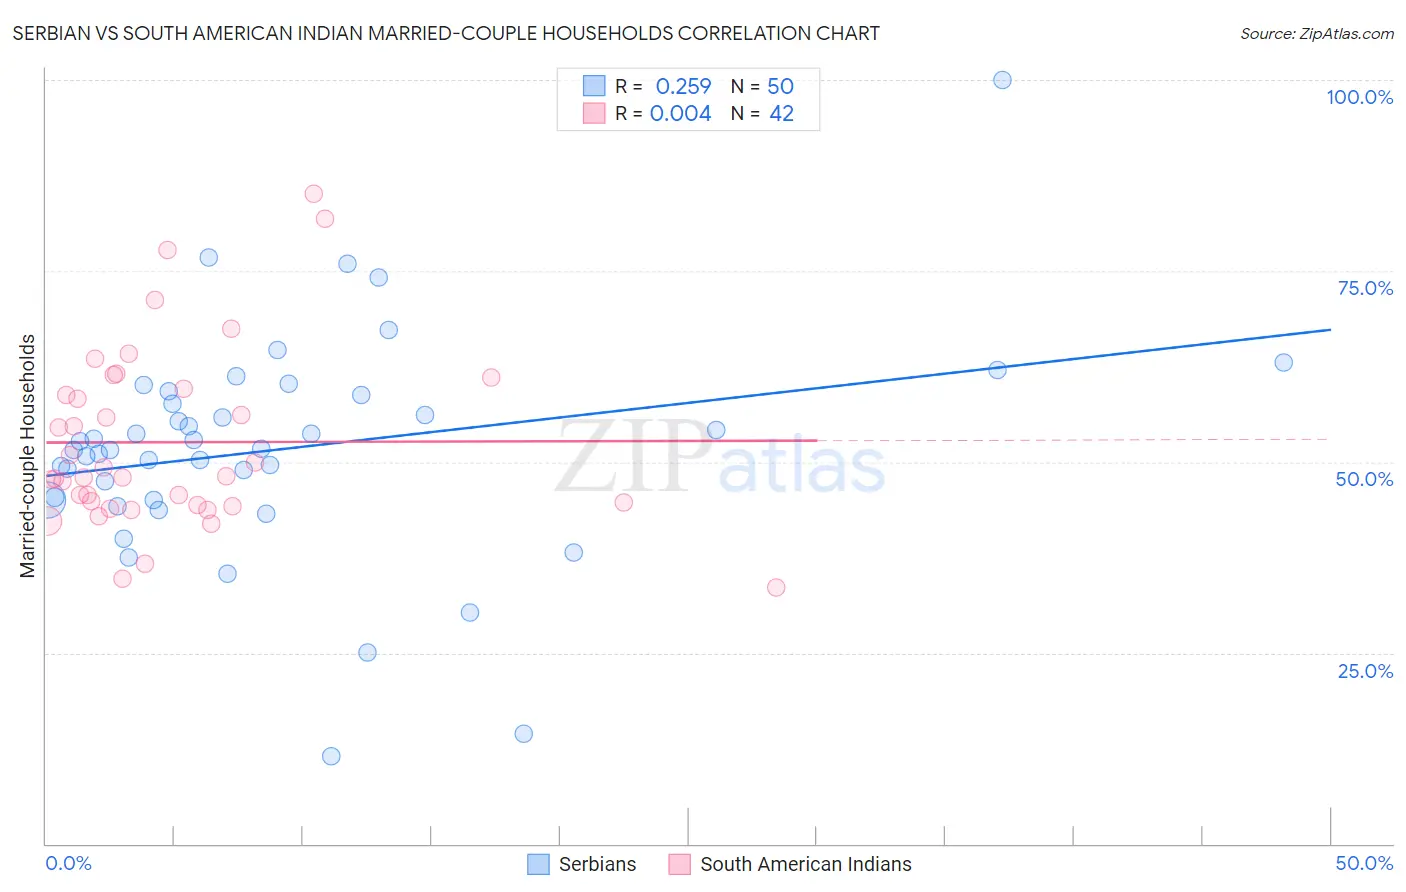
Serbian vs South American Indian Married-couple Households Correlation Chart
The statistical analysis conducted on geographies consisting of 267,530,139 people shows a weak positive correlation between the proportion of Serbians and percentage of married-couple family households in the United States with a correlation coefficient (R) of 0.259 and weighted average of 47.0%. Similarly, the statistical analysis conducted on geographies consisting of 164,540,449 people shows no correlation between the proportion of South American Indians and percentage of married-couple family households in the United States with a correlation coefficient (R) of 0.004 and weighted average of 46.0%, a difference of 2.0%.
Married-couple Households Correlation Summary
| Measurement | Serbian | South American Indian |
| Minimum | 11.4% | 33.6% |
| Maximum | 100.0% | 85.1% |
| Range | 88.6% | 51.5% |
| Mean | 51.7% | 52.6% |
| Median | 51.7% | 48.0% |
| Interquartile 25% (IQ1) | 45.0% | 44.3% |
| Interquartile 75% (IQ3) | 58.7% | 59.6% |
| Interquartile Range (IQR) | 13.7% | 15.3% |
| Standard Deviation (Sample) | 14.6% | 11.9% |
| Standard Deviation (Population) | 14.5% | 11.7% |
Similar Demographics by Married-couple Households
Demographics Similar to Serbians by Married-couple Households
In terms of married-couple households, the demographic groups most similar to Serbians are Hmong (47.0%, a difference of 0.010%), Immigrants from Western Asia (46.9%, a difference of 0.010%), Immigrants from Bulgaria (47.0%, a difference of 0.020%), Arab (46.9%, a difference of 0.020%), and Armenian (46.9%, a difference of 0.050%).
| Demographics | Rating | Rank | Married-couple Households |
| Slovenes | 81.7 /100 | #145 | Excellent 47.1% |
| Immigrants | Western Europe | 81.6 /100 | #146 | Excellent 47.1% |
| Immigrants | Syria | 81.6 /100 | #147 | Excellent 47.1% |
| Icelanders | 79.5 /100 | #148 | Good 47.0% |
| Paraguayans | 78.7 /100 | #149 | Good 47.0% |
| Immigrants | Russia | 77.6 /100 | #150 | Good 47.0% |
| Immigrants | Bulgaria | 76.8 /100 | #151 | Good 47.0% |
| Serbians | 76.3 /100 | #152 | Good 47.0% |
| Hmong | 76.2 /100 | #153 | Good 47.0% |
| Immigrants | Western Asia | 76.1 /100 | #154 | Good 46.9% |
| Arabs | 76.0 /100 | #155 | Good 46.9% |
| Armenians | 75.4 /100 | #156 | Good 46.9% |
| Immigrants | Oceania | 74.8 /100 | #157 | Good 46.9% |
| Immigrants | Nonimmigrants | 73.3 /100 | #158 | Good 46.9% |
| Osage | 73.2 /100 | #159 | Good 46.9% |
Demographics Similar to South American Indians by Married-couple Households
In terms of married-couple households, the demographic groups most similar to South American Indians are Fijian (46.1%, a difference of 0.040%), Immigrants from Latvia (46.0%, a difference of 0.070%), Albanian (46.1%, a difference of 0.13%), Immigrants from Kuwait (46.0%, a difference of 0.14%), and Choctaw (46.0%, a difference of 0.17%).
| Demographics | Rating | Rank | Married-couple Households |
| Malaysians | 41.8 /100 | #181 | Average 46.3% |
| Yugoslavians | 38.9 /100 | #182 | Fair 46.2% |
| Immigrants | Brazil | 38.3 /100 | #183 | Fair 46.2% |
| Immigrants | Switzerland | 36.9 /100 | #184 | Fair 46.2% |
| Brazilians | 35.9 /100 | #185 | Fair 46.2% |
| Albanians | 31.1 /100 | #186 | Fair 46.1% |
| Fijians | 29.2 /100 | #187 | Fair 46.1% |
| South American Indians | 28.4 /100 | #188 | Fair 46.0% |
| Immigrants | Latvia | 26.9 /100 | #189 | Fair 46.0% |
| Immigrants | Kuwait | 25.6 /100 | #190 | Fair 46.0% |
| Choctaw | 24.9 /100 | #191 | Fair 46.0% |
| Immigrants | Northern Africa | 24.6 /100 | #192 | Fair 46.0% |
| Taiwanese | 23.4 /100 | #193 | Fair 45.9% |
| Mexican American Indians | 23.3 /100 | #194 | Fair 45.9% |
| Chickasaw | 22.7 /100 | #195 | Fair 45.9% |