Scotch-Irish vs Guatemalan Married-couple Households
COMPARE
Scotch-Irish
Guatemalan
Married-couple Households
Married-couple Households Comparison
Scotch-Irish
Guatemalans
48.3%
MARRIED-COUPLE HOUSEHOLDS
98.6/ 100
METRIC RATING
72nd/ 347
METRIC RANK
43.3%
MARRIED-COUPLE HOUSEHOLDS
0.1/ 100
METRIC RATING
271st/ 347
METRIC RANK
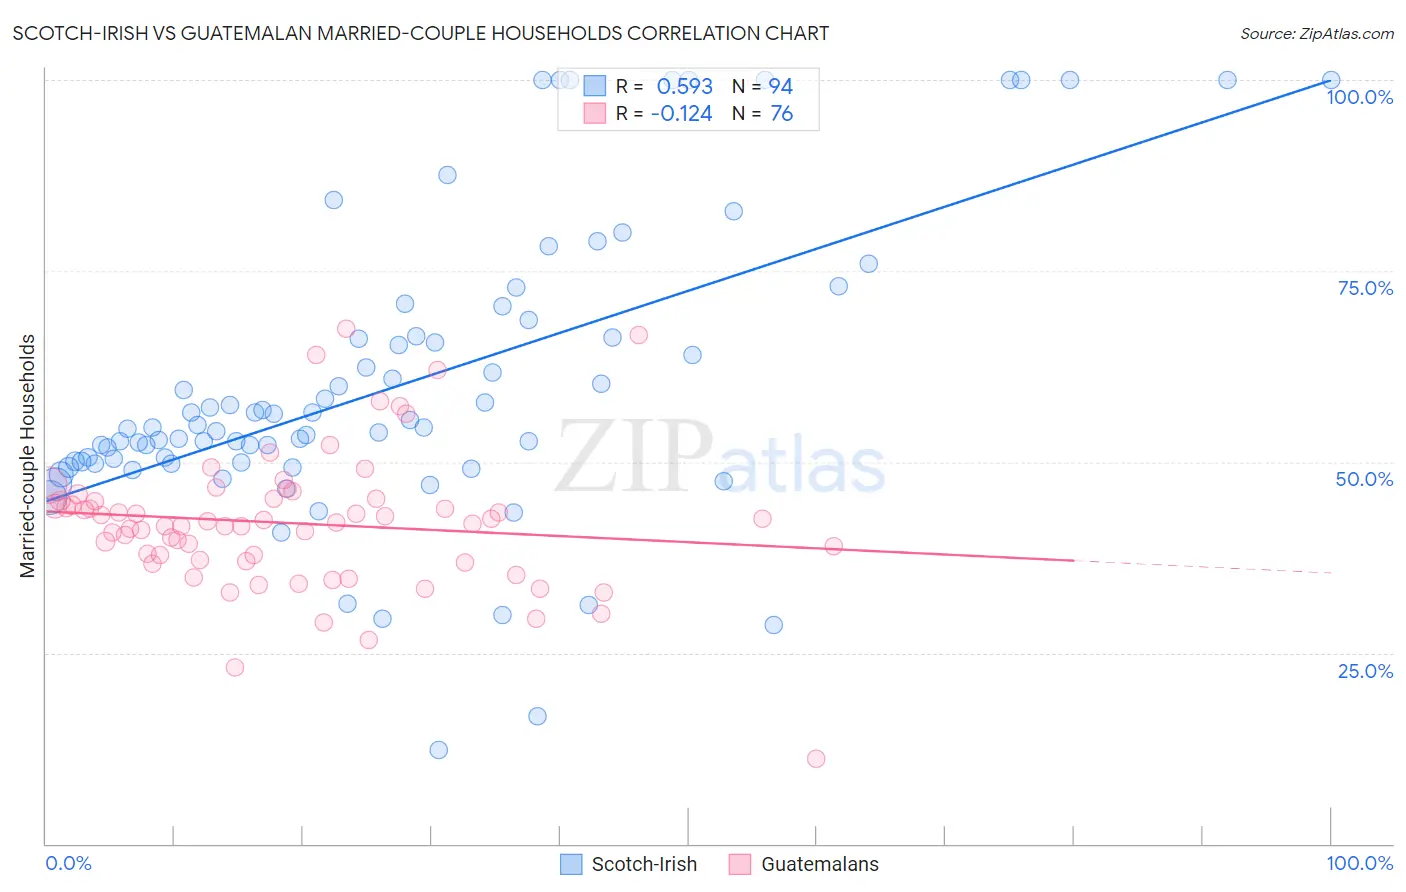
Scotch-Irish vs Guatemalan Married-couple Households Correlation Chart
The statistical analysis conducted on geographies consisting of 548,347,106 people shows a substantial positive correlation between the proportion of Scotch-Irish and percentage of married-couple family households in the United States with a correlation coefficient (R) of 0.593 and weighted average of 48.3%. Similarly, the statistical analysis conducted on geographies consisting of 409,284,876 people shows a poor negative correlation between the proportion of Guatemalans and percentage of married-couple family households in the United States with a correlation coefficient (R) of -0.124 and weighted average of 43.3%, a difference of 11.7%.
Married-couple Households Correlation Summary
| Measurement | Scotch-Irish | Guatemalan |
| Minimum | 12.2% | 11.2% |
| Maximum | 100.0% | 67.5% |
| Range | 87.8% | 56.3% |
| Mean | 60.1% | 42.0% |
| Median | 54.5% | 41.9% |
| Interquartile 25% (IQ1) | 49.9% | 37.1% |
| Interquartile 75% (IQ3) | 66.4% | 45.1% |
| Interquartile Range (IQR) | 16.6% | 8.0% |
| Standard Deviation (Sample) | 19.3% | 9.1% |
| Standard Deviation (Population) | 19.2% | 9.0% |
Similar Demographics by Married-couple Households
Demographics Similar to Scotch-Irish by Married-couple Households
In terms of married-couple households, the demographic groups most similar to Scotch-Irish are Immigrants from Singapore (48.3%, a difference of 0.020%), Immigrants from Romania (48.3%, a difference of 0.040%), Immigrants from England (48.2%, a difference of 0.12%), Immigrants from Fiji (48.2%, a difference of 0.13%), and Laotian (48.4%, a difference of 0.17%).
| Demographics | Rating | Rank | Married-couple Households |
| Immigrants | Canada | 99.0 /100 | #65 | Exceptional 48.4% |
| Jordanians | 98.9 /100 | #66 | Exceptional 48.4% |
| Romanians | 98.9 /100 | #67 | Exceptional 48.4% |
| Immigrants | South Eastern Asia | 98.9 /100 | #68 | Exceptional 48.4% |
| Immigrants | China | 98.9 /100 | #69 | Exceptional 48.4% |
| Immigrants | North America | 98.9 /100 | #70 | Exceptional 48.4% |
| Laotians | 98.8 /100 | #71 | Exceptional 48.4% |
| Scotch-Irish | 98.6 /100 | #72 | Exceptional 48.3% |
| Immigrants | Singapore | 98.6 /100 | #73 | Exceptional 48.3% |
| Immigrants | Romania | 98.6 /100 | #74 | Exceptional 48.3% |
| Immigrants | England | 98.4 /100 | #75 | Exceptional 48.2% |
| Immigrants | Fiji | 98.4 /100 | #76 | Exceptional 48.2% |
| Canadians | 98.2 /100 | #77 | Exceptional 48.2% |
| Egyptians | 98.2 /100 | #78 | Exceptional 48.2% |
| Immigrants | Netherlands | 98.2 /100 | #79 | Exceptional 48.2% |
Demographics Similar to Guatemalans by Married-couple Households
In terms of married-couple households, the demographic groups most similar to Guatemalans are Yuman (43.3%, a difference of 0.11%), Immigrants from Nigeria (43.2%, a difference of 0.11%), Immigrants from Sierra Leone (43.3%, a difference of 0.15%), Ethiopian (43.2%, a difference of 0.20%), and Nigerian (43.2%, a difference of 0.21%).
| Demographics | Rating | Rank | Married-couple Households |
| Bangladeshis | 0.1 /100 | #264 | Tragic 43.5% |
| Moroccans | 0.1 /100 | #265 | Tragic 43.5% |
| Ecuadorians | 0.1 /100 | #266 | Tragic 43.5% |
| Natives/Alaskans | 0.1 /100 | #267 | Tragic 43.5% |
| Immigrants | Burma/Myanmar | 0.1 /100 | #268 | Tragic 43.4% |
| Immigrants | Sierra Leone | 0.1 /100 | #269 | Tragic 43.3% |
| Yuman | 0.1 /100 | #270 | Tragic 43.3% |
| Guatemalans | 0.1 /100 | #271 | Tragic 43.3% |
| Immigrants | Nigeria | 0.1 /100 | #272 | Tragic 43.2% |
| Ethiopians | 0.1 /100 | #273 | Tragic 43.2% |
| Nigerians | 0.1 /100 | #274 | Tragic 43.2% |
| Immigrants | Bangladesh | 0.0 /100 | #275 | Tragic 43.1% |
| Immigrants | Ethiopia | 0.0 /100 | #276 | Tragic 43.1% |
| Immigrants | Eastern Africa | 0.0 /100 | #277 | Tragic 42.9% |
| Immigrants | Africa | 0.0 /100 | #278 | Tragic 42.9% |