Scotch-Irish vs Cheyenne Family Households with Children
COMPARE
Scotch-Irish
Cheyenne
Family Households with Children
Family Households with Children Comparison
Scotch-Irish
Cheyenne
26.8%
FAMILY HOUSEHOLDS WITH CHILDREN
1.4/ 100
METRIC RATING
256th/ 347
METRIC RANK
27.4%
FAMILY HOUSEHOLDS WITH CHILDREN
35.1/ 100
METRIC RATING
196th/ 347
METRIC RANK
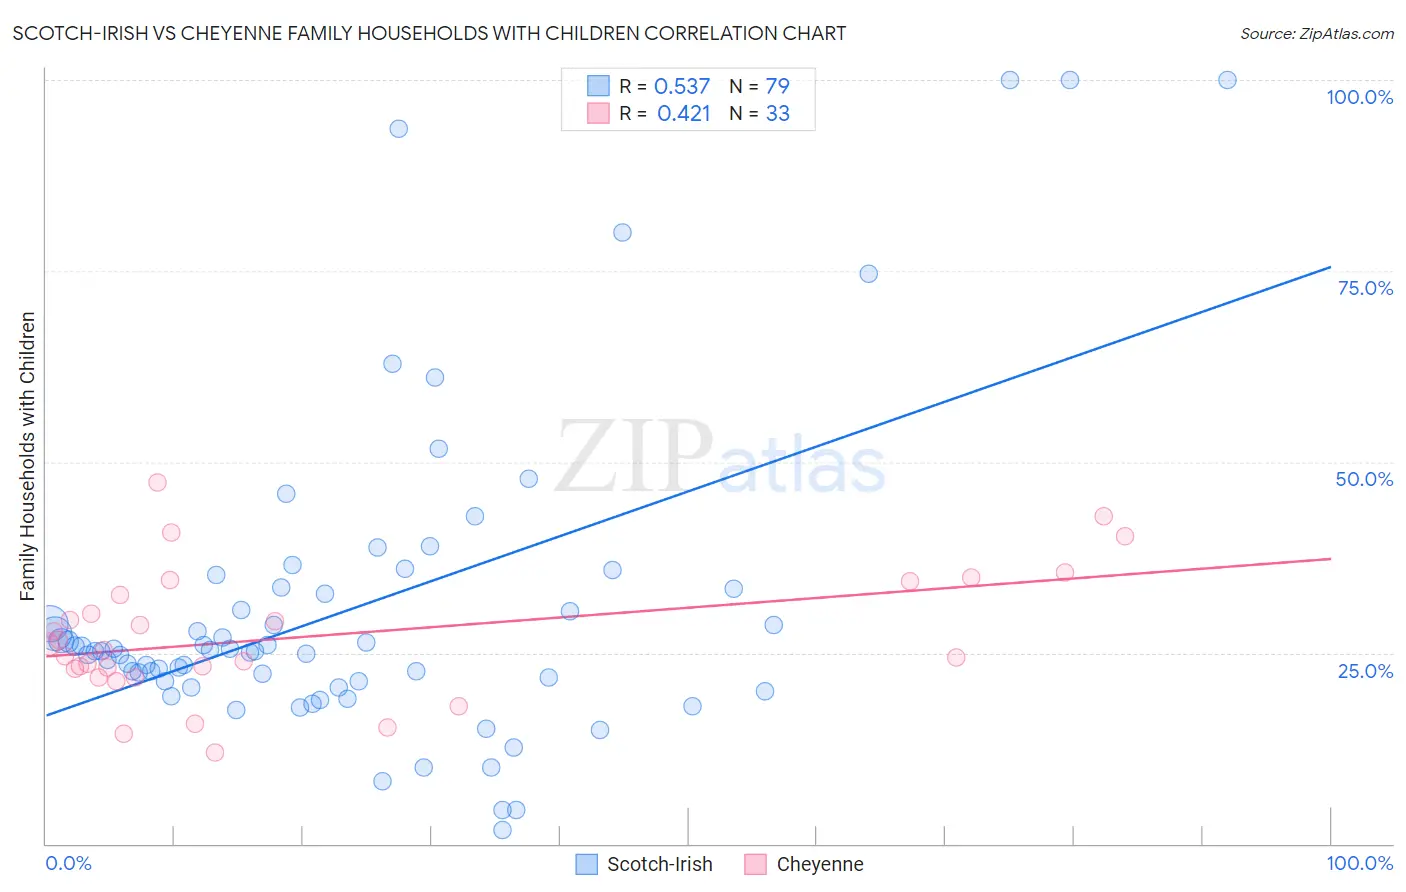
Scotch-Irish vs Cheyenne Family Households with Children Correlation Chart
The statistical analysis conducted on geographies consisting of 548,065,437 people shows a substantial positive correlation between the proportion of Scotch-Irish and percentage of family households with children in the United States with a correlation coefficient (R) of 0.537 and weighted average of 26.8%. Similarly, the statistical analysis conducted on geographies consisting of 80,669,159 people shows a moderate positive correlation between the proportion of Cheyenne and percentage of family households with children in the United States with a correlation coefficient (R) of 0.421 and weighted average of 27.4%, a difference of 2.0%.
Family Households with Children Correlation Summary
| Measurement | Scotch-Irish | Cheyenne |
| Minimum | 1.9% | 12.0% |
| Maximum | 100.0% | 47.4% |
| Range | 98.1% | 35.3% |
| Mean | 30.8% | 27.1% |
| Median | 25.3% | 25.4% |
| Interquartile 25% (IQ1) | 21.2% | 22.4% |
| Interquartile 75% (IQ3) | 33.3% | 33.4% |
| Interquartile Range (IQR) | 12.1% | 11.1% |
| Standard Deviation (Sample) | 20.6% | 8.4% |
| Standard Deviation (Population) | 20.5% | 8.2% |
Similar Demographics by Family Households with Children
Demographics Similar to Scotch-Irish by Family Households with Children
In terms of family households with children, the demographic groups most similar to Scotch-Irish are German Russian (26.8%, a difference of 0.010%), Immigrants from Scotland (26.8%, a difference of 0.020%), Italian (26.8%, a difference of 0.050%), Slavic (26.8%, a difference of 0.050%), and Immigrants from Cuba (26.8%, a difference of 0.050%).
| Demographics | Rating | Rank | Family Households with Children |
| Immigrants | Eastern Europe | 2.1 /100 | #249 | Tragic 26.9% |
| Belgians | 2.1 /100 | #250 | Tragic 26.9% |
| Immigrants | Bosnia and Herzegovina | 1.9 /100 | #251 | Tragic 26.8% |
| Irish | 1.8 /100 | #252 | Tragic 26.8% |
| Italians | 1.5 /100 | #253 | Tragic 26.8% |
| Immigrants | Scotland | 1.5 /100 | #254 | Tragic 26.8% |
| German Russians | 1.5 /100 | #255 | Tragic 26.8% |
| Scotch-Irish | 1.4 /100 | #256 | Tragic 26.8% |
| Slavs | 1.3 /100 | #257 | Tragic 26.8% |
| Immigrants | Cuba | 1.3 /100 | #258 | Tragic 26.8% |
| Immigrants | Lithuania | 1.2 /100 | #259 | Tragic 26.8% |
| Immigrants | Jamaica | 1.2 /100 | #260 | Tragic 26.8% |
| Immigrants | Belarus | 1.1 /100 | #261 | Tragic 26.8% |
| Immigrants | Russia | 1.0 /100 | #262 | Tragic 26.8% |
| Immigrants | North Macedonia | 1.0 /100 | #263 | Tragic 26.7% |
Demographics Similar to Cheyenne by Family Households with Children
In terms of family households with children, the demographic groups most similar to Cheyenne are Norwegian (27.4%, a difference of 0.0%), Immigrants from Iran (27.4%, a difference of 0.020%), Crow (27.4%, a difference of 0.020%), Immigrants from Romania (27.4%, a difference of 0.020%), and Swedish (27.4%, a difference of 0.040%).
| Demographics | Rating | Rank | Family Households with Children |
| Immigrants | Israel | 37.9 /100 | #189 | Fair 27.4% |
| Immigrants | Uruguay | 37.7 /100 | #190 | Fair 27.4% |
| Sudanese | 37.6 /100 | #191 | Fair 27.4% |
| Pennsylvania Germans | 37.5 /100 | #192 | Fair 27.4% |
| Swedes | 36.9 /100 | #193 | Fair 27.4% |
| Immigrants | Iran | 36.1 /100 | #194 | Fair 27.4% |
| Crow | 35.7 /100 | #195 | Fair 27.4% |
| Cheyenne | 35.1 /100 | #196 | Fair 27.4% |
| Norwegians | 35.0 /100 | #197 | Fair 27.4% |
| Immigrants | Romania | 34.4 /100 | #198 | Fair 27.4% |
| English | 32.0 /100 | #199 | Fair 27.3% |
| Immigrants | Congo | 28.7 /100 | #200 | Fair 27.3% |
| Bhutanese | 25.1 /100 | #201 | Fair 27.3% |
| Americans | 22.8 /100 | #202 | Fair 27.3% |
| Kiowa | 22.2 /100 | #203 | Fair 27.3% |