Scotch-Irish vs Immigrants from Egypt Family Households with Children
COMPARE
Scotch-Irish
Immigrants from Egypt
Family Households with Children
Family Households with Children Comparison
Scotch-Irish
Immigrants from Egypt
26.8%
FAMILY HOUSEHOLDS WITH CHILDREN
1.4/ 100
METRIC RATING
256th/ 347
METRIC RANK
28.5%
FAMILY HOUSEHOLDS WITH CHILDREN
99.9/ 100
METRIC RATING
66th/ 347
METRIC RANK
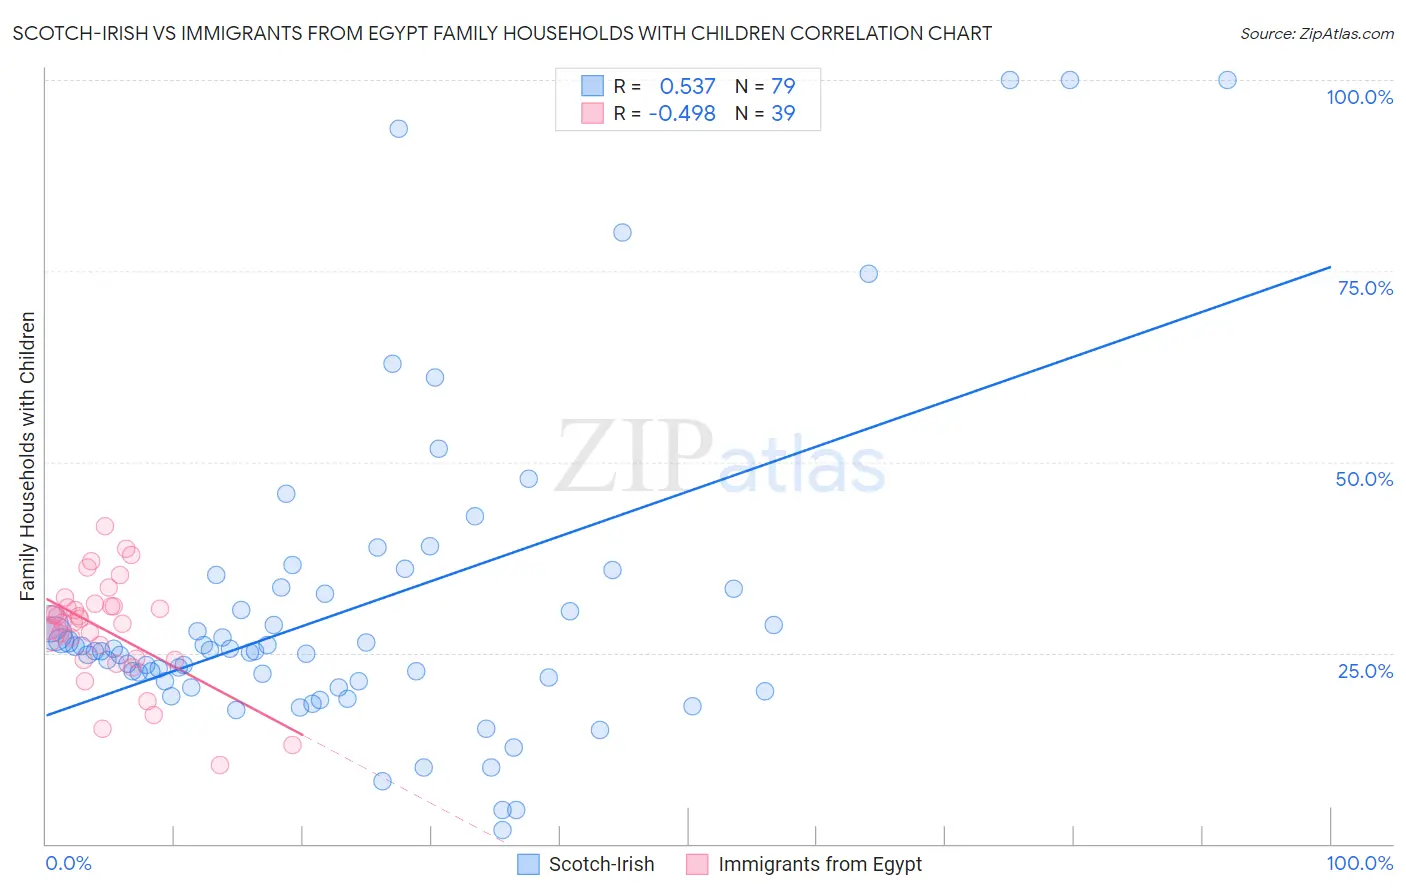
Scotch-Irish vs Immigrants from Egypt Family Households with Children Correlation Chart
The statistical analysis conducted on geographies consisting of 548,065,437 people shows a substantial positive correlation between the proportion of Scotch-Irish and percentage of family households with children in the United States with a correlation coefficient (R) of 0.537 and weighted average of 26.8%. Similarly, the statistical analysis conducted on geographies consisting of 245,400,532 people shows a moderate negative correlation between the proportion of Immigrants from Egypt and percentage of family households with children in the United States with a correlation coefficient (R) of -0.498 and weighted average of 28.5%, a difference of 6.4%.
Family Households with Children Correlation Summary
| Measurement | Scotch-Irish | Immigrants from Egypt |
| Minimum | 1.9% | 10.3% |
| Maximum | 100.0% | 41.6% |
| Range | 98.1% | 31.3% |
| Mean | 30.8% | 28.0% |
| Median | 25.3% | 29.0% |
| Interquartile 25% (IQ1) | 21.2% | 24.1% |
| Interquartile 75% (IQ3) | 33.3% | 31.1% |
| Interquartile Range (IQR) | 12.1% | 7.0% |
| Standard Deviation (Sample) | 20.6% | 6.8% |
| Standard Deviation (Population) | 20.5% | 6.8% |
Similar Demographics by Family Households with Children
Demographics Similar to Scotch-Irish by Family Households with Children
In terms of family households with children, the demographic groups most similar to Scotch-Irish are German Russian (26.8%, a difference of 0.010%), Immigrants from Scotland (26.8%, a difference of 0.020%), Italian (26.8%, a difference of 0.050%), Slavic (26.8%, a difference of 0.050%), and Immigrants from Cuba (26.8%, a difference of 0.050%).
| Demographics | Rating | Rank | Family Households with Children |
| Immigrants | Eastern Europe | 2.1 /100 | #249 | Tragic 26.9% |
| Belgians | 2.1 /100 | #250 | Tragic 26.9% |
| Immigrants | Bosnia and Herzegovina | 1.9 /100 | #251 | Tragic 26.8% |
| Irish | 1.8 /100 | #252 | Tragic 26.8% |
| Italians | 1.5 /100 | #253 | Tragic 26.8% |
| Immigrants | Scotland | 1.5 /100 | #254 | Tragic 26.8% |
| German Russians | 1.5 /100 | #255 | Tragic 26.8% |
| Scotch-Irish | 1.4 /100 | #256 | Tragic 26.8% |
| Slavs | 1.3 /100 | #257 | Tragic 26.8% |
| Immigrants | Cuba | 1.3 /100 | #258 | Tragic 26.8% |
| Immigrants | Lithuania | 1.2 /100 | #259 | Tragic 26.8% |
| Immigrants | Jamaica | 1.2 /100 | #260 | Tragic 26.8% |
| Immigrants | Belarus | 1.1 /100 | #261 | Tragic 26.8% |
| Immigrants | Russia | 1.0 /100 | #262 | Tragic 26.8% |
| Immigrants | North Macedonia | 1.0 /100 | #263 | Tragic 26.7% |
Demographics Similar to Immigrants from Egypt by Family Households with Children
In terms of family households with children, the demographic groups most similar to Immigrants from Egypt are Honduran (28.5%, a difference of 0.0%), Ghanaian (28.5%, a difference of 0.0%), Houma (28.5%, a difference of 0.020%), Immigrants from Korea (28.5%, a difference of 0.040%), and Filipino (28.6%, a difference of 0.080%).
| Demographics | Rating | Rank | Family Households with Children |
| Immigrants | Nigeria | 100.0 /100 | #59 | Exceptional 28.6% |
| Hmong | 99.9 /100 | #60 | Exceptional 28.6% |
| Immigrants | Ghana | 99.9 /100 | #61 | Exceptional 28.6% |
| Egyptians | 99.9 /100 | #62 | Exceptional 28.6% |
| Immigrants | Lebanon | 99.9 /100 | #63 | Exceptional 28.6% |
| Filipinos | 99.9 /100 | #64 | Exceptional 28.6% |
| Hondurans | 99.9 /100 | #65 | Exceptional 28.5% |
| Immigrants | Egypt | 99.9 /100 | #66 | Exceptional 28.5% |
| Ghanaians | 99.9 /100 | #67 | Exceptional 28.5% |
| Houma | 99.9 /100 | #68 | Exceptional 28.5% |
| Immigrants | Korea | 99.9 /100 | #69 | Exceptional 28.5% |
| Immigrants | Honduras | 99.9 /100 | #70 | Exceptional 28.5% |
| Burmese | 99.9 /100 | #71 | Exceptional 28.5% |
| Immigrants | Indonesia | 99.9 /100 | #72 | Exceptional 28.5% |
| Iraqis | 99.9 /100 | #73 | Exceptional 28.5% |