Scotch-Irish vs Immigrants from Bolivia Family Households with Children
COMPARE
Scotch-Irish
Immigrants from Bolivia
Family Households with Children
Family Households with Children Comparison
Scotch-Irish
Immigrants from Bolivia
26.8%
FAMILY HOUSEHOLDS WITH CHILDREN
1.4/ 100
METRIC RATING
256th/ 347
METRIC RANK
29.3%
FAMILY HOUSEHOLDS WITH CHILDREN
100.0/ 100
METRIC RATING
34th/ 347
METRIC RANK
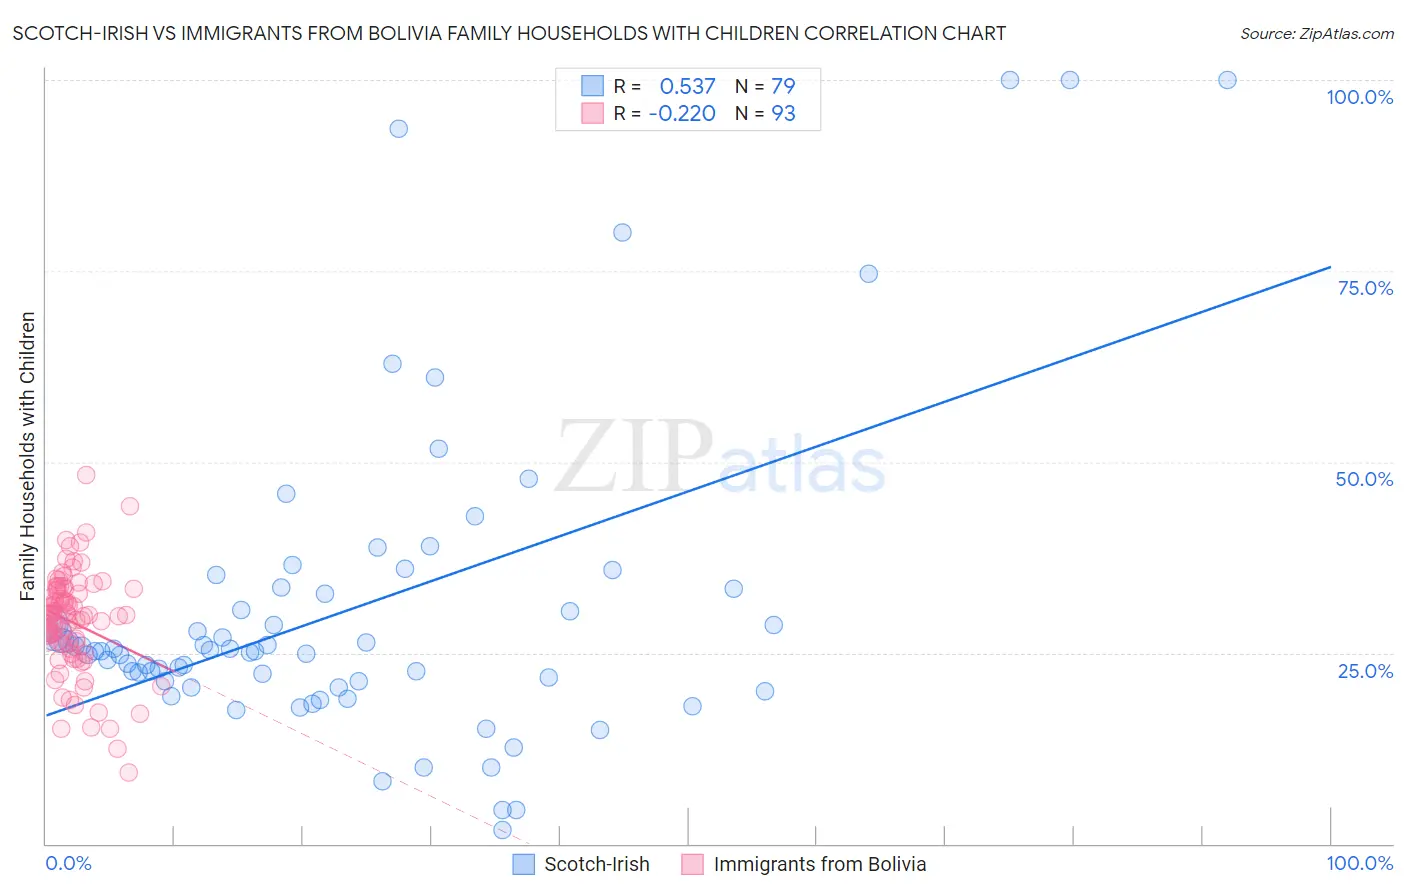
Scotch-Irish vs Immigrants from Bolivia Family Households with Children Correlation Chart
The statistical analysis conducted on geographies consisting of 548,065,437 people shows a substantial positive correlation between the proportion of Scotch-Irish and percentage of family households with children in the United States with a correlation coefficient (R) of 0.537 and weighted average of 26.8%. Similarly, the statistical analysis conducted on geographies consisting of 158,666,427 people shows a weak negative correlation between the proportion of Immigrants from Bolivia and percentage of family households with children in the United States with a correlation coefficient (R) of -0.220 and weighted average of 29.3%, a difference of 9.5%.
Family Households with Children Correlation Summary
| Measurement | Scotch-Irish | Immigrants from Bolivia |
| Minimum | 1.9% | 9.4% |
| Maximum | 100.0% | 48.4% |
| Range | 98.1% | 39.0% |
| Mean | 30.8% | 29.0% |
| Median | 25.3% | 29.9% |
| Interquartile 25% (IQ1) | 21.2% | 25.8% |
| Interquartile 75% (IQ3) | 33.3% | 33.3% |
| Interquartile Range (IQR) | 12.1% | 7.4% |
| Standard Deviation (Sample) | 20.6% | 6.7% |
| Standard Deviation (Population) | 20.5% | 6.7% |
Similar Demographics by Family Households with Children
Demographics Similar to Scotch-Irish by Family Households with Children
In terms of family households with children, the demographic groups most similar to Scotch-Irish are German Russian (26.8%, a difference of 0.010%), Immigrants from Scotland (26.8%, a difference of 0.020%), Italian (26.8%, a difference of 0.050%), Slavic (26.8%, a difference of 0.050%), and Immigrants from Cuba (26.8%, a difference of 0.050%).
| Demographics | Rating | Rank | Family Households with Children |
| Immigrants | Eastern Europe | 2.1 /100 | #249 | Tragic 26.9% |
| Belgians | 2.1 /100 | #250 | Tragic 26.9% |
| Immigrants | Bosnia and Herzegovina | 1.9 /100 | #251 | Tragic 26.8% |
| Irish | 1.8 /100 | #252 | Tragic 26.8% |
| Italians | 1.5 /100 | #253 | Tragic 26.8% |
| Immigrants | Scotland | 1.5 /100 | #254 | Tragic 26.8% |
| German Russians | 1.5 /100 | #255 | Tragic 26.8% |
| Scotch-Irish | 1.4 /100 | #256 | Tragic 26.8% |
| Slavs | 1.3 /100 | #257 | Tragic 26.8% |
| Immigrants | Cuba | 1.3 /100 | #258 | Tragic 26.8% |
| Immigrants | Lithuania | 1.2 /100 | #259 | Tragic 26.8% |
| Immigrants | Jamaica | 1.2 /100 | #260 | Tragic 26.8% |
| Immigrants | Belarus | 1.1 /100 | #261 | Tragic 26.8% |
| Immigrants | Russia | 1.0 /100 | #262 | Tragic 26.8% |
| Immigrants | North Macedonia | 1.0 /100 | #263 | Tragic 26.7% |
Demographics Similar to Immigrants from Bolivia by Family Households with Children
In terms of family households with children, the demographic groups most similar to Immigrants from Bolivia are Venezuelan (29.4%, a difference of 0.060%), Immigrants from Sierra Leone (29.3%, a difference of 0.16%), Immigrants from Venezuela (29.3%, a difference of 0.17%), Immigrants from Yemen (29.4%, a difference of 0.25%), and Japanese (29.4%, a difference of 0.31%).
| Demographics | Rating | Rank | Family Households with Children |
| Immigrants | Vietnam | 100.0 /100 | #27 | Exceptional 29.5% |
| Samoans | 100.0 /100 | #28 | Exceptional 29.5% |
| Bolivians | 100.0 /100 | #29 | Exceptional 29.5% |
| Yuman | 100.0 /100 | #30 | Exceptional 29.5% |
| Japanese | 100.0 /100 | #31 | Exceptional 29.4% |
| Immigrants | Yemen | 100.0 /100 | #32 | Exceptional 29.4% |
| Venezuelans | 100.0 /100 | #33 | Exceptional 29.4% |
| Immigrants | Bolivia | 100.0 /100 | #34 | Exceptional 29.3% |
| Immigrants | Sierra Leone | 100.0 /100 | #35 | Exceptional 29.3% |
| Immigrants | Venezuela | 100.0 /100 | #36 | Exceptional 29.3% |
| Immigrants | Cameroon | 100.0 /100 | #37 | Exceptional 29.2% |
| Koreans | 100.0 /100 | #38 | Exceptional 29.2% |
| Yaqui | 100.0 /100 | #39 | Exceptional 29.1% |
| Central Americans | 100.0 /100 | #40 | Exceptional 29.1% |
| Immigrants | South Eastern Asia | 100.0 /100 | #41 | Exceptional 29.1% |