Immigrants from the Azores vs Cheyenne Family Households with Children
COMPARE
Immigrants from the Azores
Cheyenne
Family Households with Children
Family Households with Children Comparison
Immigrants from the Azores
Cheyenne
28.1%
FAMILY HOUSEHOLDS WITH CHILDREN
98.8/ 100
METRIC RATING
99th/ 347
METRIC RANK
27.4%
FAMILY HOUSEHOLDS WITH CHILDREN
35.1/ 100
METRIC RATING
196th/ 347
METRIC RANK
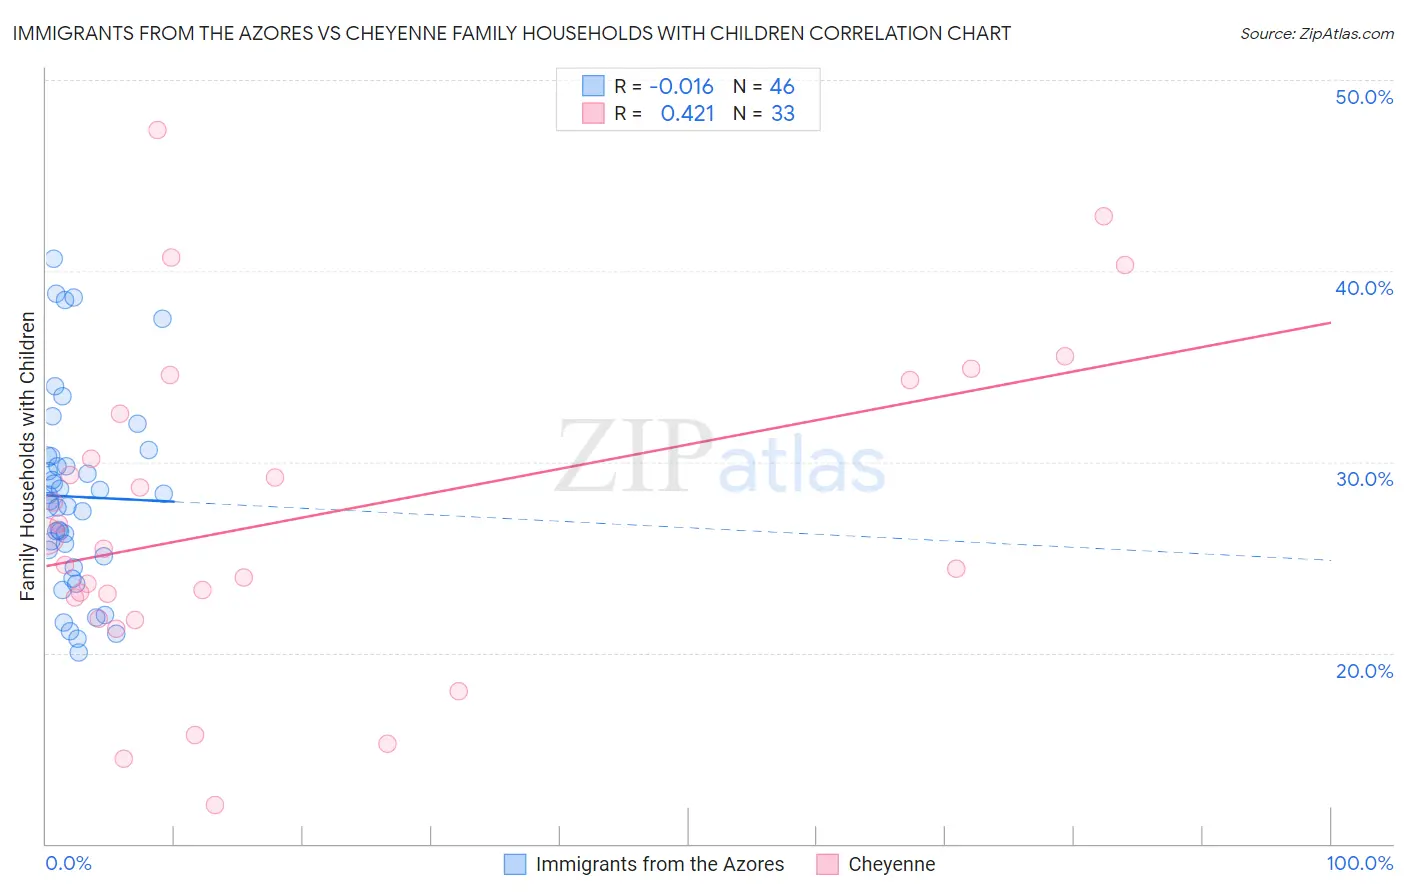
Immigrants from the Azores vs Cheyenne Family Households with Children Correlation Chart
The statistical analysis conducted on geographies consisting of 46,253,049 people shows no correlation between the proportion of Immigrants from the Azores and percentage of family households with children in the United States with a correlation coefficient (R) of -0.016 and weighted average of 28.1%. Similarly, the statistical analysis conducted on geographies consisting of 80,669,159 people shows a moderate positive correlation between the proportion of Cheyenne and percentage of family households with children in the United States with a correlation coefficient (R) of 0.421 and weighted average of 27.4%, a difference of 2.8%.
Family Households with Children Correlation Summary
| Measurement | Immigrants from the Azores | Cheyenne |
| Minimum | 20.0% | 12.0% |
| Maximum | 40.6% | 47.4% |
| Range | 20.6% | 35.3% |
| Mean | 28.2% | 27.1% |
| Median | 27.8% | 25.4% |
| Interquartile 25% (IQ1) | 25.0% | 22.4% |
| Interquartile 75% (IQ3) | 30.3% | 33.4% |
| Interquartile Range (IQR) | 5.2% | 11.1% |
| Standard Deviation (Sample) | 5.1% | 8.4% |
| Standard Deviation (Population) | 5.0% | 8.2% |
Similar Demographics by Family Households with Children
Demographics Similar to Immigrants from the Azores by Family Households with Children
In terms of family households with children, the demographic groups most similar to Immigrants from the Azores are Indonesian (28.1%, a difference of 0.0%), Immigrants from Kenya (28.1%, a difference of 0.010%), Immigrants from Oceania (28.1%, a difference of 0.020%), Chilean (28.1%, a difference of 0.050%), and Assyrian/Chaldean/Syriac (28.1%, a difference of 0.050%).
| Demographics | Rating | Rank | Family Households with Children |
| Chickasaw | 99.4 /100 | #92 | Exceptional 28.2% |
| Panamanians | 99.3 /100 | #93 | Exceptional 28.2% |
| Immigrants | Colombia | 99.2 /100 | #94 | Exceptional 28.2% |
| Immigrants | Nicaragua | 99.1 /100 | #95 | Exceptional 28.2% |
| Ute | 99.1 /100 | #96 | Exceptional 28.2% |
| Chileans | 98.9 /100 | #97 | Exceptional 28.1% |
| Immigrants | Kenya | 98.9 /100 | #98 | Exceptional 28.1% |
| Immigrants | Azores | 98.8 /100 | #99 | Exceptional 28.1% |
| Indonesians | 98.8 /100 | #100 | Exceptional 28.1% |
| Immigrants | Oceania | 98.8 /100 | #101 | Exceptional 28.1% |
| Assyrians/Chaldeans/Syriacs | 98.7 /100 | #102 | Exceptional 28.1% |
| Palestinians | 98.5 /100 | #103 | Exceptional 28.1% |
| Sioux | 98.3 /100 | #104 | Exceptional 28.1% |
| Choctaw | 98.3 /100 | #105 | Exceptional 28.1% |
| Immigrants | South America | 98.0 /100 | #106 | Exceptional 28.0% |
Demographics Similar to Cheyenne by Family Households with Children
In terms of family households with children, the demographic groups most similar to Cheyenne are Norwegian (27.4%, a difference of 0.0%), Immigrants from Iran (27.4%, a difference of 0.020%), Crow (27.4%, a difference of 0.020%), Immigrants from Romania (27.4%, a difference of 0.020%), and Swedish (27.4%, a difference of 0.040%).
| Demographics | Rating | Rank | Family Households with Children |
| Immigrants | Israel | 37.9 /100 | #189 | Fair 27.4% |
| Immigrants | Uruguay | 37.7 /100 | #190 | Fair 27.4% |
| Sudanese | 37.6 /100 | #191 | Fair 27.4% |
| Pennsylvania Germans | 37.5 /100 | #192 | Fair 27.4% |
| Swedes | 36.9 /100 | #193 | Fair 27.4% |
| Immigrants | Iran | 36.1 /100 | #194 | Fair 27.4% |
| Crow | 35.7 /100 | #195 | Fair 27.4% |
| Cheyenne | 35.1 /100 | #196 | Fair 27.4% |
| Norwegians | 35.0 /100 | #197 | Fair 27.4% |
| Immigrants | Romania | 34.4 /100 | #198 | Fair 27.4% |
| English | 32.0 /100 | #199 | Fair 27.3% |
| Immigrants | Congo | 28.7 /100 | #200 | Fair 27.3% |
| Bhutanese | 25.1 /100 | #201 | Fair 27.3% |
| Americans | 22.8 /100 | #202 | Fair 27.3% |
| Kiowa | 22.2 /100 | #203 | Fair 27.3% |