Native/Alaskan vs Nepalese Family Households
COMPARE
Native/Alaskan
Nepalese
Family Households
Family Households Comparison
Natives/Alaskans
Nepalese
66.4%
FAMILY HOUSEHOLDS
100.0/ 100
METRIC RATING
51st/ 347
METRIC RANK
67.2%
FAMILY HOUSEHOLDS
100.0/ 100
METRIC RATING
32nd/ 347
METRIC RANK
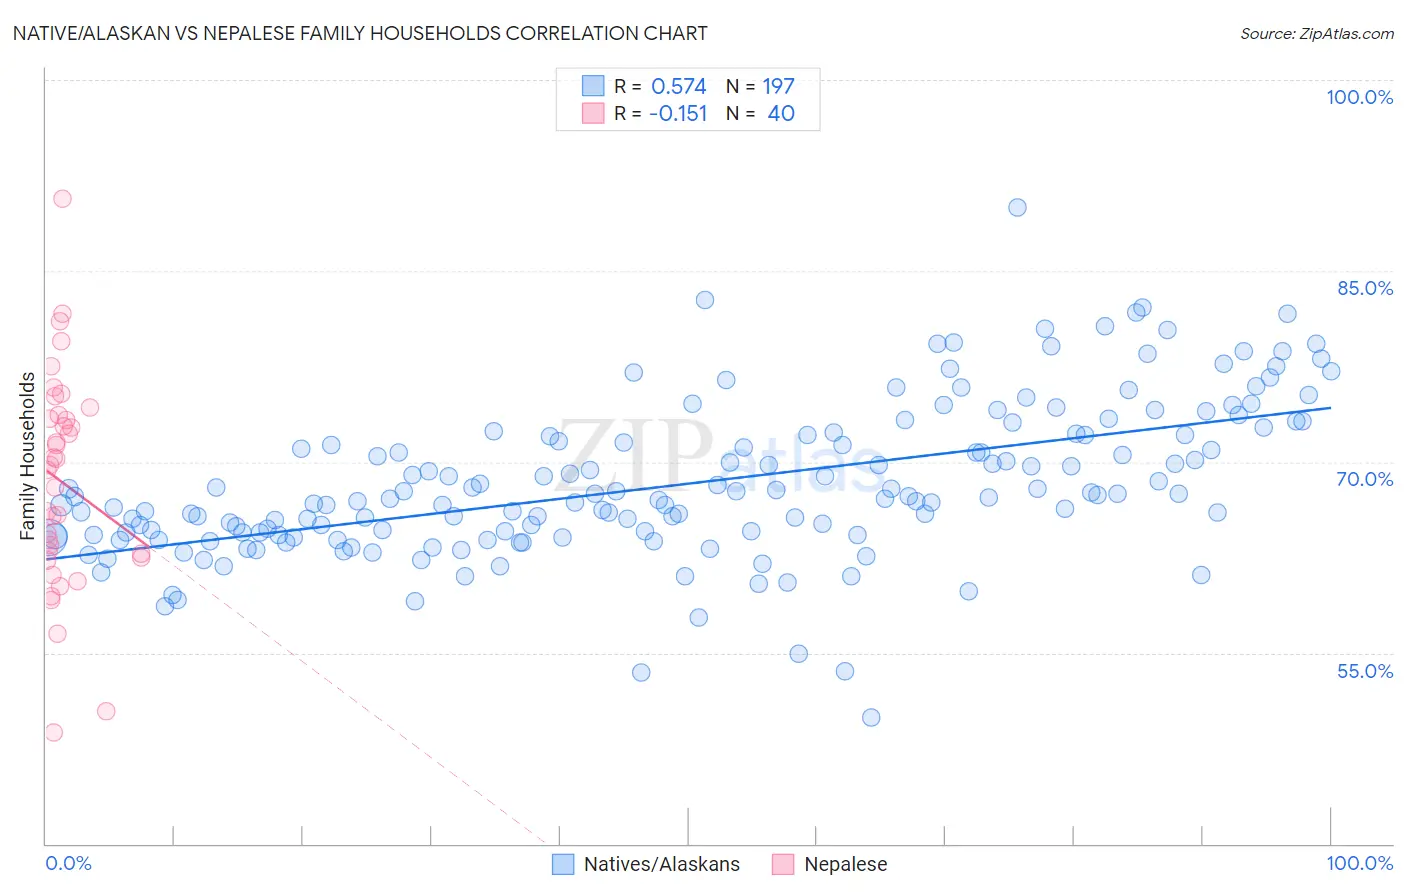
Native/Alaskan vs Nepalese Family Households Correlation Chart
The statistical analysis conducted on geographies consisting of 512,654,863 people shows a substantial positive correlation between the proportion of Natives/Alaskans and percentage of family households in the United States with a correlation coefficient (R) of 0.574 and weighted average of 66.4%. Similarly, the statistical analysis conducted on geographies consisting of 24,521,755 people shows a poor negative correlation between the proportion of Nepalese and percentage of family households in the United States with a correlation coefficient (R) of -0.151 and weighted average of 67.2%, a difference of 1.3%.
Family Households Correlation Summary
| Measurement | Native/Alaskan | Nepalese |
| Minimum | 49.9% | 48.7% |
| Maximum | 90.0% | 90.6% |
| Range | 40.1% | 41.9% |
| Mean | 68.3% | 68.4% |
| Median | 67.2% | 69.5% |
| Interquartile 25% (IQ1) | 64.2% | 62.7% |
| Interquartile 75% (IQ3) | 72.1% | 73.5% |
| Interquartile Range (IQR) | 7.9% | 10.9% |
| Standard Deviation (Sample) | 6.0% | 8.5% |
| Standard Deviation (Population) | 6.0% | 8.4% |
Demographics Similar to Natives/Alaskans and Nepalese by Family Households
In terms of family households, the demographic groups most similar to Natives/Alaskans are Navajo (66.4%, a difference of 0.030%), Immigrants from South Central Asia (66.4%, a difference of 0.090%), Immigrants from Venezuela (66.4%, a difference of 0.14%), Bolivian (66.5%, a difference of 0.16%), and Arapaho (66.5%, a difference of 0.19%). Similarly, the demographic groups most similar to Nepalese are Salvadoran (67.2%, a difference of 0.040%), Thai (67.2%, a difference of 0.040%), Immigrants from Latin America (67.2%, a difference of 0.060%), Tohono O'odham (67.1%, a difference of 0.090%), and Peruvian (67.1%, a difference of 0.11%).
| Demographics | Rating | Rank | Family Households |
| Immigrants | Latin America | 100.0 /100 | #31 | Exceptional 67.2% |
| Nepalese | 100.0 /100 | #32 | Exceptional 67.2% |
| Salvadorans | 100.0 /100 | #33 | Exceptional 67.2% |
| Thais | 100.0 /100 | #34 | Exceptional 67.2% |
| Tohono O'odham | 100.0 /100 | #35 | Exceptional 67.1% |
| Peruvians | 100.0 /100 | #36 | Exceptional 67.1% |
| Tsimshian | 100.0 /100 | #37 | Exceptional 67.1% |
| Mexican American Indians | 100.0 /100 | #38 | Exceptional 67.0% |
| Immigrants | El Salvador | 100.0 /100 | #39 | Exceptional 67.0% |
| Guamanians/Chamorros | 100.0 /100 | #40 | Exceptional 66.6% |
| Immigrants | Bolivia | 100.0 /100 | #41 | Exceptional 66.6% |
| Menominee | 100.0 /100 | #42 | Exceptional 66.5% |
| Apache | 100.0 /100 | #43 | Exceptional 66.5% |
| Asians | 100.0 /100 | #44 | Exceptional 66.5% |
| Venezuelans | 100.0 /100 | #45 | Exceptional 66.5% |
| Arapaho | 100.0 /100 | #46 | Exceptional 66.5% |
| Bolivians | 100.0 /100 | #47 | Exceptional 66.5% |
| Immigrants | Venezuela | 100.0 /100 | #48 | Exceptional 66.4% |
| Immigrants | South Central Asia | 100.0 /100 | #49 | Exceptional 66.4% |
| Navajo | 100.0 /100 | #50 | Exceptional 66.4% |
| Natives/Alaskans | 100.0 /100 | #51 | Exceptional 66.4% |