Kiowa vs Nepalese Family Households
COMPARE
Kiowa
Nepalese
Family Households
Family Households Comparison
Kiowa
Nepalese
61.4%
FAMILY HOUSEHOLDS
0.0/ 100
METRIC RATING
328th/ 347
METRIC RANK
67.2%
FAMILY HOUSEHOLDS
100.0/ 100
METRIC RATING
32nd/ 347
METRIC RANK
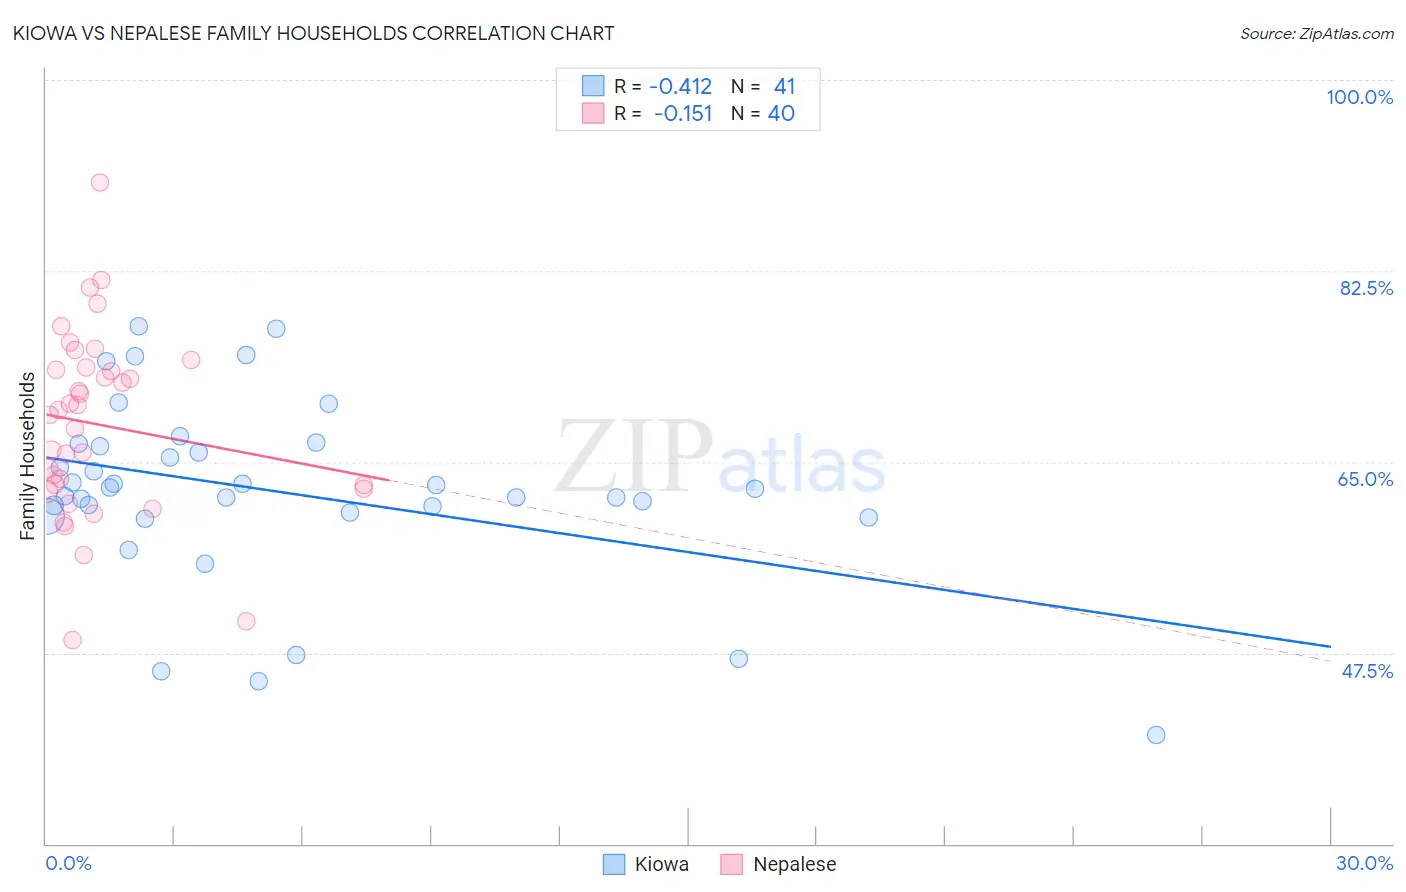
Kiowa vs Nepalese Family Households Correlation Chart
The statistical analysis conducted on geographies consisting of 56,099,396 people shows a moderate negative correlation between the proportion of Kiowa and percentage of family households in the United States with a correlation coefficient (R) of -0.412 and weighted average of 61.4%. Similarly, the statistical analysis conducted on geographies consisting of 24,521,755 people shows a poor negative correlation between the proportion of Nepalese and percentage of family households in the United States with a correlation coefficient (R) of -0.151 and weighted average of 67.2%, a difference of 9.5%.
Family Households Correlation Summary
| Measurement | Kiowa | Nepalese |
| Minimum | 40.0% | 48.7% |
| Maximum | 77.4% | 90.6% |
| Range | 37.4% | 41.9% |
| Mean | 62.3% | 68.4% |
| Median | 62.6% | 69.5% |
| Interquartile 25% (IQ1) | 60.1% | 62.7% |
| Interquartile 75% (IQ3) | 66.6% | 73.5% |
| Interquartile Range (IQR) | 6.4% | 10.9% |
| Standard Deviation (Sample) | 8.3% | 8.5% |
| Standard Deviation (Population) | 8.2% | 8.4% |
Similar Demographics by Family Households
Demographics Similar to Kiowa by Family Households
In terms of family households, the demographic groups most similar to Kiowa are Cambodian (61.4%, a difference of 0.030%), Black/African American (61.5%, a difference of 0.13%), Indonesian (61.5%, a difference of 0.15%), Immigrants from Australia (61.3%, a difference of 0.16%), and Immigrants from France (61.3%, a difference of 0.16%).
| Demographics | Rating | Rank | Family Households |
| Alsatians | 0.0 /100 | #321 | Tragic 61.7% |
| Immigrants | Serbia | 0.0 /100 | #322 | Tragic 61.6% |
| Tlingit-Haida | 0.0 /100 | #323 | Tragic 61.6% |
| Immigrants | West Indies | 0.0 /100 | #324 | Tragic 61.6% |
| Immigrants | Switzerland | 0.0 /100 | #325 | Tragic 61.6% |
| Indonesians | 0.0 /100 | #326 | Tragic 61.5% |
| Blacks/African Americans | 0.0 /100 | #327 | Tragic 61.5% |
| Kiowa | 0.0 /100 | #328 | Tragic 61.4% |
| Cambodians | 0.0 /100 | #329 | Tragic 61.4% |
| Immigrants | Australia | 0.0 /100 | #330 | Tragic 61.3% |
| Immigrants | France | 0.0 /100 | #331 | Tragic 61.3% |
| Ethiopians | 0.0 /100 | #332 | Tragic 61.2% |
| Immigrants | Ethiopia | 0.0 /100 | #333 | Tragic 61.2% |
| Immigrants | Eastern Africa | 0.0 /100 | #334 | Tragic 61.1% |
| Carpatho Rusyns | 0.0 /100 | #335 | Tragic 61.1% |
Demographics Similar to Nepalese by Family Households
In terms of family households, the demographic groups most similar to Nepalese are Salvadoran (67.2%, a difference of 0.040%), Thai (67.2%, a difference of 0.040%), Immigrants from Latin America (67.2%, a difference of 0.060%), Immigrants from Peru (67.2%, a difference of 0.070%), and Tohono O'odham (67.1%, a difference of 0.090%).
| Demographics | Rating | Rank | Family Households |
| Immigrants | Nicaragua | 100.0 /100 | #25 | Exceptional 67.5% |
| Immigrants | India | 100.0 /100 | #26 | Exceptional 67.4% |
| Hispanics or Latinos | 100.0 /100 | #27 | Exceptional 67.4% |
| Hawaiians | 100.0 /100 | #28 | Exceptional 67.4% |
| Nicaraguans | 100.0 /100 | #29 | Exceptional 67.4% |
| Immigrants | Peru | 100.0 /100 | #30 | Exceptional 67.2% |
| Immigrants | Latin America | 100.0 /100 | #31 | Exceptional 67.2% |
| Nepalese | 100.0 /100 | #32 | Exceptional 67.2% |
| Salvadorans | 100.0 /100 | #33 | Exceptional 67.2% |
| Thais | 100.0 /100 | #34 | Exceptional 67.2% |
| Tohono O'odham | 100.0 /100 | #35 | Exceptional 67.1% |
| Peruvians | 100.0 /100 | #36 | Exceptional 67.1% |
| Tsimshian | 100.0 /100 | #37 | Exceptional 67.1% |
| Mexican American Indians | 100.0 /100 | #38 | Exceptional 67.0% |
| Immigrants | El Salvador | 100.0 /100 | #39 | Exceptional 67.0% |