Immigrants from Singapore vs Nepalese Family Households
COMPARE
Immigrants from Singapore
Nepalese
Family Households
Family Households Comparison
Immigrants from Singapore
Nepalese
63.1%
FAMILY HOUSEHOLDS
0.4/ 100
METRIC RATING
268th/ 347
METRIC RANK
67.2%
FAMILY HOUSEHOLDS
100.0/ 100
METRIC RATING
32nd/ 347
METRIC RANK
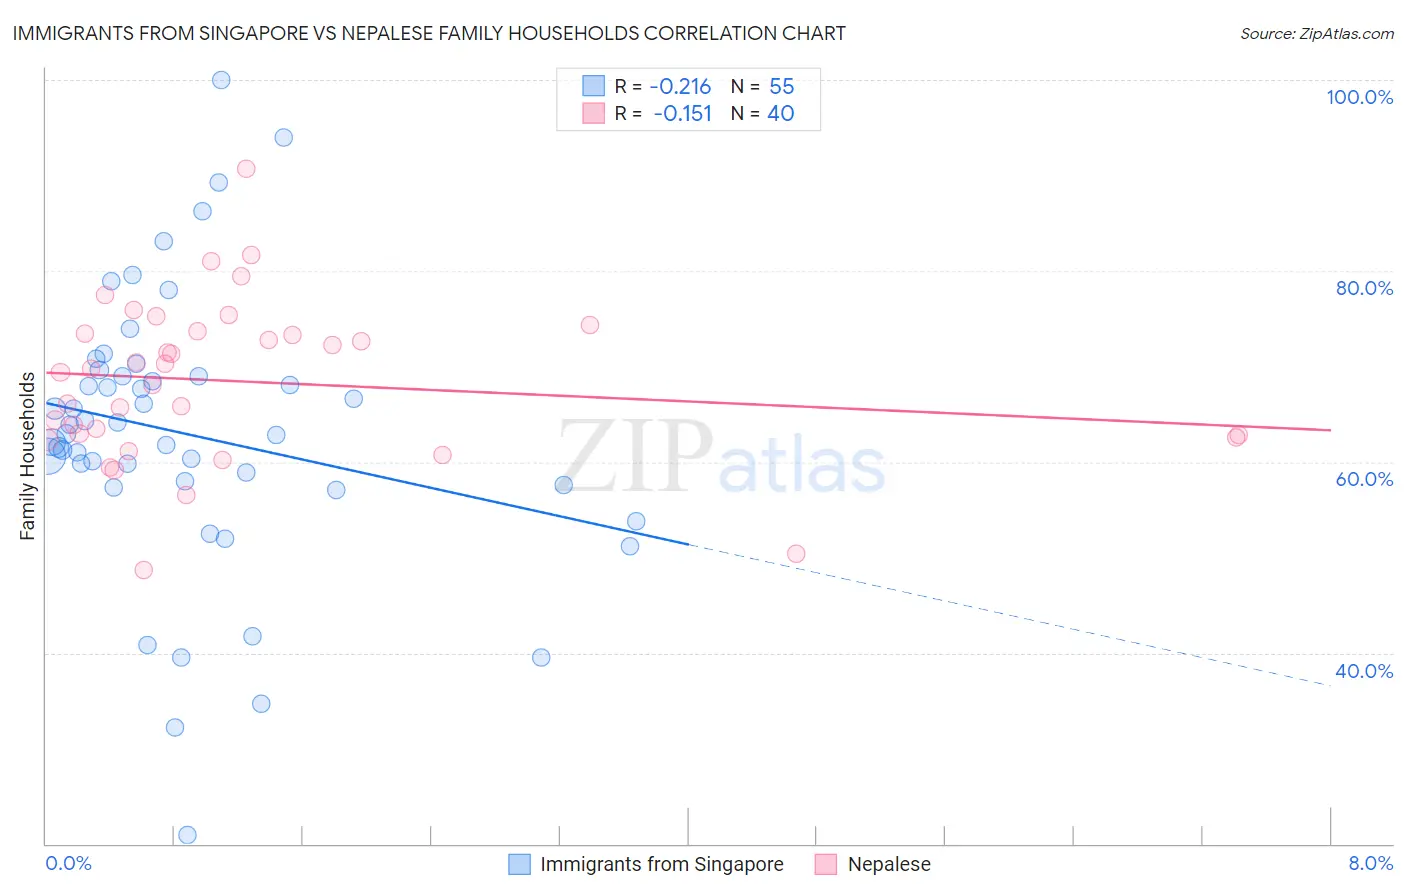
Immigrants from Singapore vs Nepalese Family Households Correlation Chart
The statistical analysis conducted on geographies consisting of 137,456,675 people shows a weak negative correlation between the proportion of Immigrants from Singapore and percentage of family households in the United States with a correlation coefficient (R) of -0.216 and weighted average of 63.1%. Similarly, the statistical analysis conducted on geographies consisting of 24,521,755 people shows a poor negative correlation between the proportion of Nepalese and percentage of family households in the United States with a correlation coefficient (R) of -0.151 and weighted average of 67.2%, a difference of 6.5%.
Family Households Correlation Summary
| Measurement | Immigrants from Singapore | Nepalese |
| Minimum | 20.9% | 48.7% |
| Maximum | 100.0% | 90.6% |
| Range | 79.1% | 41.9% |
| Mean | 62.9% | 68.4% |
| Median | 62.9% | 69.5% |
| Interquartile 25% (IQ1) | 57.5% | 62.7% |
| Interquartile 75% (IQ3) | 69.0% | 73.5% |
| Interquartile Range (IQR) | 11.5% | 10.9% |
| Standard Deviation (Sample) | 14.6% | 8.5% |
| Standard Deviation (Population) | 14.5% | 8.4% |
Similar Demographics by Family Households
Demographics Similar to Immigrants from Singapore by Family Households
In terms of family households, the demographic groups most similar to Immigrants from Singapore are Yugoslavian (63.1%, a difference of 0.0%), Immigrants from Austria (63.1%, a difference of 0.020%), Immigrants from Croatia (63.1%, a difference of 0.030%), Immigrants from Turkey (63.1%, a difference of 0.030%), and Immigrants from Kazakhstan (63.1%, a difference of 0.040%).
| Demographics | Rating | Rank | Family Households |
| Immigrants | Russia | 0.6 /100 | #261 | Tragic 63.2% |
| Immigrants | Ireland | 0.6 /100 | #262 | Tragic 63.2% |
| Cheyenne | 0.5 /100 | #263 | Tragic 63.2% |
| Kenyans | 0.5 /100 | #264 | Tragic 63.2% |
| Colville | 0.5 /100 | #265 | Tragic 63.2% |
| Immigrants | Western Africa | 0.5 /100 | #266 | Tragic 63.1% |
| Israelis | 0.4 /100 | #267 | Tragic 63.1% |
| Immigrants | Singapore | 0.4 /100 | #268 | Tragic 63.1% |
| Yugoslavians | 0.4 /100 | #269 | Tragic 63.1% |
| Immigrants | Austria | 0.3 /100 | #270 | Tragic 63.1% |
| Immigrants | Croatia | 0.3 /100 | #271 | Tragic 63.1% |
| Immigrants | Turkey | 0.3 /100 | #272 | Tragic 63.1% |
| Immigrants | Kazakhstan | 0.3 /100 | #273 | Tragic 63.1% |
| Lumbee | 0.3 /100 | #274 | Tragic 63.1% |
| West Indians | 0.3 /100 | #275 | Tragic 63.1% |
Demographics Similar to Nepalese by Family Households
In terms of family households, the demographic groups most similar to Nepalese are Salvadoran (67.2%, a difference of 0.040%), Thai (67.2%, a difference of 0.040%), Immigrants from Latin America (67.2%, a difference of 0.060%), Immigrants from Peru (67.2%, a difference of 0.070%), and Tohono O'odham (67.1%, a difference of 0.090%).
| Demographics | Rating | Rank | Family Households |
| Immigrants | Nicaragua | 100.0 /100 | #25 | Exceptional 67.5% |
| Immigrants | India | 100.0 /100 | #26 | Exceptional 67.4% |
| Hispanics or Latinos | 100.0 /100 | #27 | Exceptional 67.4% |
| Hawaiians | 100.0 /100 | #28 | Exceptional 67.4% |
| Nicaraguans | 100.0 /100 | #29 | Exceptional 67.4% |
| Immigrants | Peru | 100.0 /100 | #30 | Exceptional 67.2% |
| Immigrants | Latin America | 100.0 /100 | #31 | Exceptional 67.2% |
| Nepalese | 100.0 /100 | #32 | Exceptional 67.2% |
| Salvadorans | 100.0 /100 | #33 | Exceptional 67.2% |
| Thais | 100.0 /100 | #34 | Exceptional 67.2% |
| Tohono O'odham | 100.0 /100 | #35 | Exceptional 67.1% |
| Peruvians | 100.0 /100 | #36 | Exceptional 67.1% |
| Tsimshian | 100.0 /100 | #37 | Exceptional 67.1% |
| Mexican American Indians | 100.0 /100 | #38 | Exceptional 67.0% |
| Immigrants | El Salvador | 100.0 /100 | #39 | Exceptional 67.0% |