Native/Alaskan vs Estonian Births to Unmarried Women
COMPARE
Native/Alaskan
Estonian
Births to Unmarried Women
Births to Unmarried Women Comparison
Natives/Alaskans
Estonians
43.0%
BIRTHS TO UNMARRIED WOMEN
0.0/ 100
METRIC RATING
331st/ 347
METRIC RANK
29.2%
BIRTHS TO UNMARRIED WOMEN
96.5/ 100
METRIC RATING
93rd/ 347
METRIC RANK
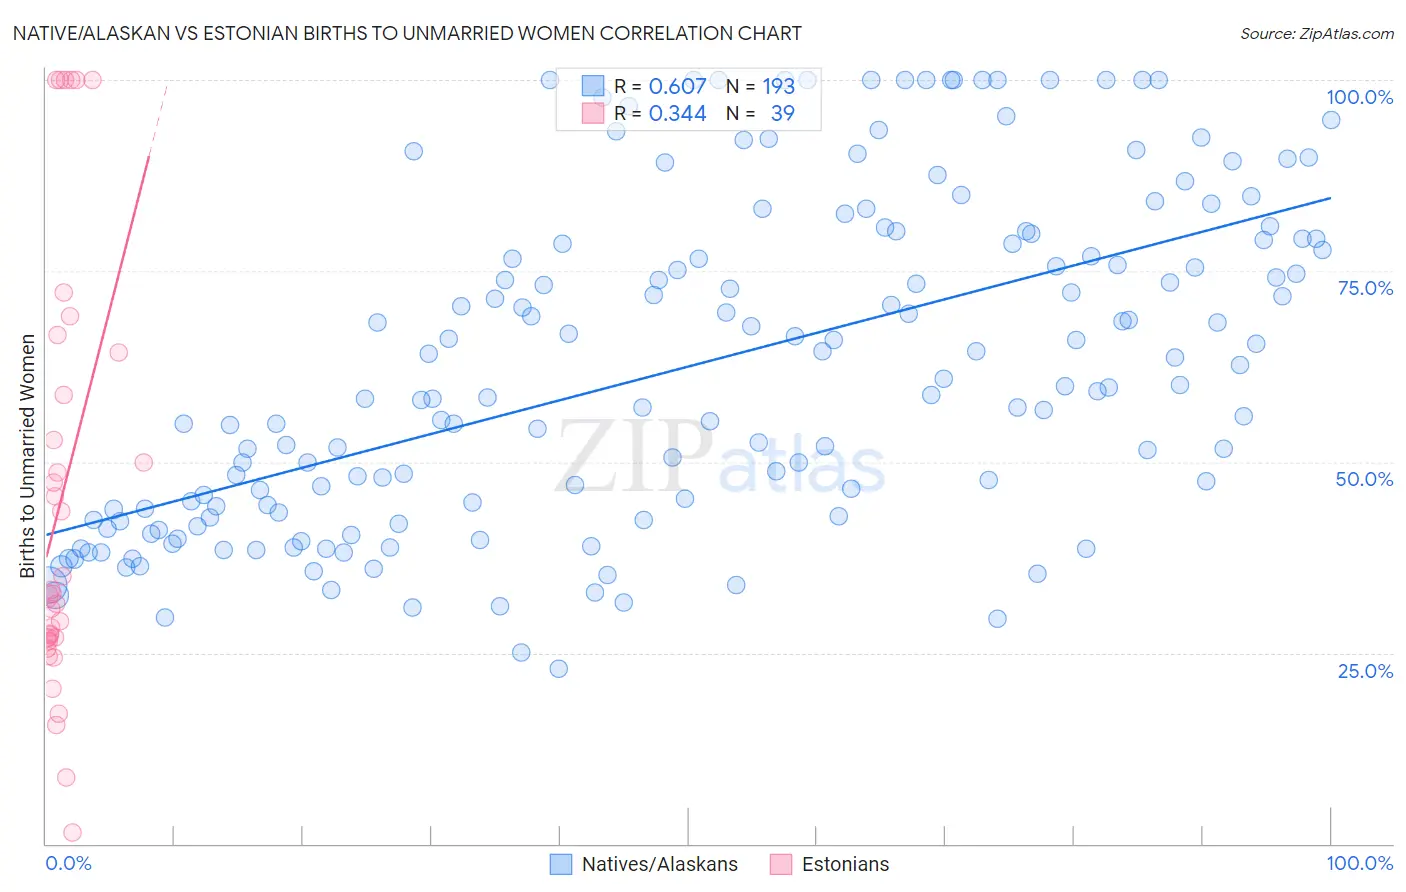
Native/Alaskan vs Estonian Births to Unmarried Women Correlation Chart
The statistical analysis conducted on geographies consisting of 471,404,476 people shows a significant positive correlation between the proportion of Natives/Alaskans and percentage of births to unmarried women in the United States with a correlation coefficient (R) of 0.607 and weighted average of 43.0%. Similarly, the statistical analysis conducted on geographies consisting of 118,165,296 people shows a mild positive correlation between the proportion of Estonians and percentage of births to unmarried women in the United States with a correlation coefficient (R) of 0.344 and weighted average of 29.2%, a difference of 47.2%.
Births to Unmarried Women Correlation Summary
| Measurement | Native/Alaskan | Estonian |
| Minimum | 22.9% | 1.4% |
| Maximum | 100.0% | 100.0% |
| Range | 77.1% | 98.6% |
| Mean | 62.5% | 45.4% |
| Median | 59.8% | 32.7% |
| Interquartile 25% (IQ1) | 43.2% | 26.9% |
| Interquartile 75% (IQ3) | 79.1% | 64.3% |
| Interquartile Range (IQR) | 35.9% | 37.4% |
| Standard Deviation (Sample) | 21.3% | 28.4% |
| Standard Deviation (Population) | 21.3% | 28.1% |
Similar Demographics by Births to Unmarried Women
Demographics Similar to Natives/Alaskans by Births to Unmarried Women
In terms of births to unmarried women, the demographic groups most similar to Natives/Alaskans are Kiowa (43.1%, a difference of 0.35%), Chippewa (42.6%, a difference of 0.83%), Paiute (42.5%, a difference of 1.2%), Immigrants from Cabo Verde (42.2%, a difference of 1.8%), and Tsimshian (42.2%, a difference of 2.0%).
| Demographics | Rating | Rank | Births to Unmarried Women |
| Cape Verdeans | 0.0 /100 | #324 | Tragic 41.3% |
| Cheyenne | 0.0 /100 | #325 | Tragic 41.3% |
| Immigrants | Cuba | 0.0 /100 | #326 | Tragic 41.5% |
| Tsimshian | 0.0 /100 | #327 | Tragic 42.2% |
| Immigrants | Cabo Verde | 0.0 /100 | #328 | Tragic 42.2% |
| Paiute | 0.0 /100 | #329 | Tragic 42.5% |
| Chippewa | 0.0 /100 | #330 | Tragic 42.6% |
| Natives/Alaskans | 0.0 /100 | #331 | Tragic 43.0% |
| Kiowa | 0.0 /100 | #332 | Tragic 43.1% |
| Blacks/African Americans | 0.0 /100 | #333 | Tragic 44.3% |
| Yuman | 0.0 /100 | #334 | Tragic 44.4% |
| Colville | 0.0 /100 | #335 | Tragic 45.3% |
| Puerto Ricans | 0.0 /100 | #336 | Tragic 45.7% |
| Houma | 0.0 /100 | #337 | Tragic 46.6% |
| Arapaho | 0.0 /100 | #338 | Tragic 47.1% |
Demographics Similar to Estonians by Births to Unmarried Women
In terms of births to unmarried women, the demographic groups most similar to Estonians are Arab (29.2%, a difference of 0.040%), Immigrants from Fiji (29.2%, a difference of 0.080%), Ukrainian (29.2%, a difference of 0.12%), Immigrants from Vietnam (29.3%, a difference of 0.26%), and Immigrants from Latvia (29.1%, a difference of 0.29%).
| Demographics | Rating | Rank | Births to Unmarried Women |
| Immigrants | Jordan | 97.4 /100 | #86 | Exceptional 29.0% |
| Taiwanese | 97.3 /100 | #87 | Exceptional 29.0% |
| Immigrants | France | 97.3 /100 | #88 | Exceptional 29.0% |
| Immigrants | Saudi Arabia | 97.0 /100 | #89 | Exceptional 29.1% |
| Immigrants | Latvia | 96.8 /100 | #90 | Exceptional 29.1% |
| Immigrants | Fiji | 96.6 /100 | #91 | Exceptional 29.2% |
| Arabs | 96.5 /100 | #92 | Exceptional 29.2% |
| Estonians | 96.5 /100 | #93 | Exceptional 29.2% |
| Ukrainians | 96.3 /100 | #94 | Exceptional 29.2% |
| Immigrants | Vietnam | 96.1 /100 | #95 | Exceptional 29.3% |
| Norwegians | 95.8 /100 | #96 | Exceptional 29.3% |
| Immigrants | South Africa | 95.7 /100 | #97 | Exceptional 29.3% |
| Immigrants | Syria | 95.7 /100 | #98 | Exceptional 29.4% |
| Immigrants | Denmark | 95.3 /100 | #99 | Exceptional 29.4% |
| Luxembourgers | 95.2 /100 | #100 | Exceptional 29.4% |