Native/Alaskan vs Estonian Child Poverty Under the Age of 16
COMPARE
Native/Alaskan
Estonian
Child Poverty Under the Age of 16
Child Poverty Under the Age of 16 Comparison
Natives/Alaskans
Estonians
23.8%
CHILD POVERTY UNDER THE AGE OF 16
0.0/ 100
METRIC RATING
330th/ 347
METRIC RANK
13.9%
CHILD POVERTY UNDER THE AGE OF 16
99.2/ 100
METRIC RATING
47th/ 347
METRIC RANK
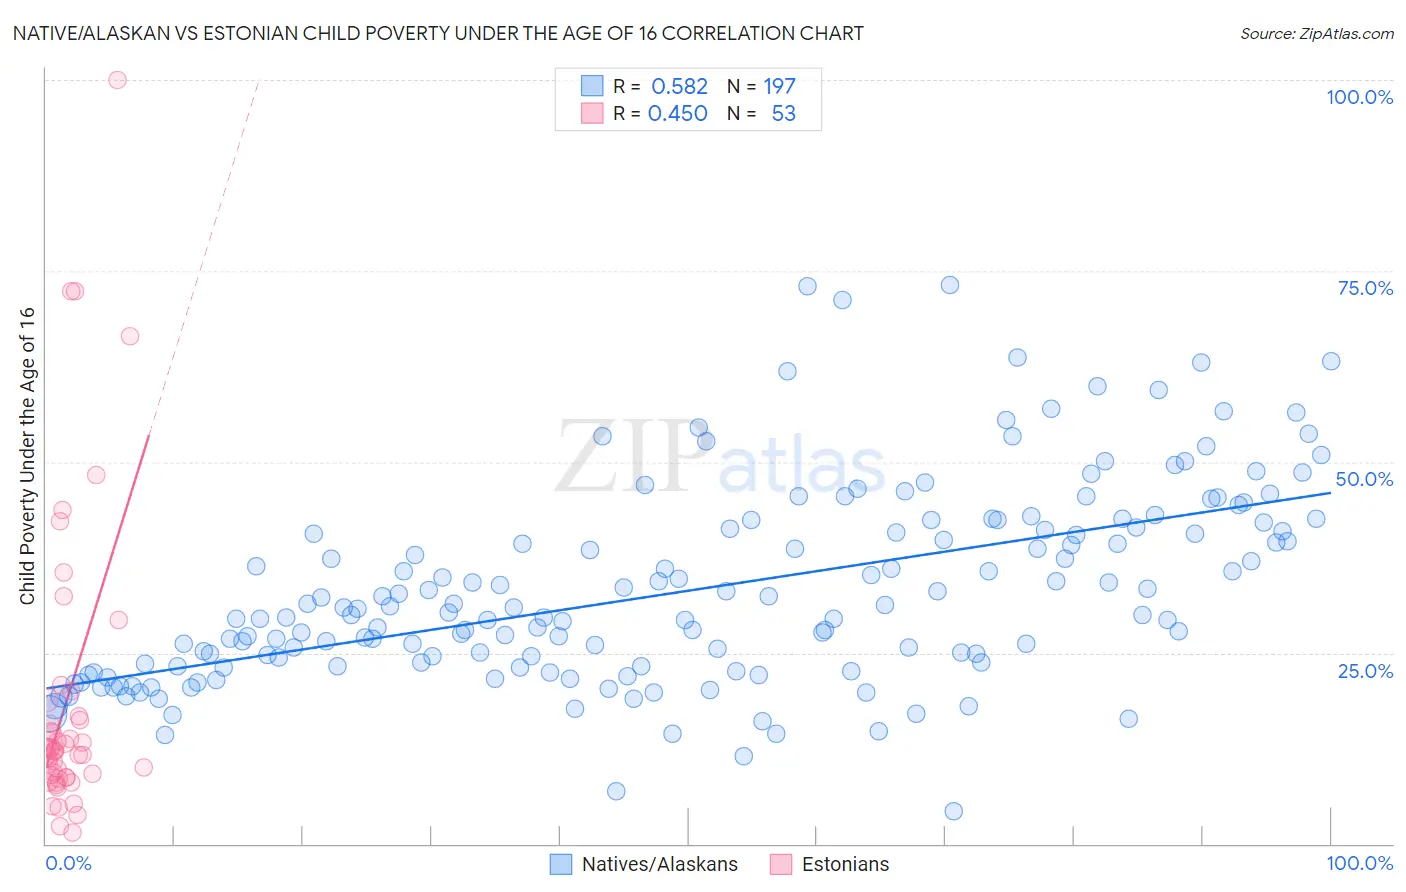
Native/Alaskan vs Estonian Child Poverty Under the Age of 16 Correlation Chart
The statistical analysis conducted on geographies consisting of 507,337,670 people shows a substantial positive correlation between the proportion of Natives/Alaskans and poverty level among children under the age of 16 in the United States with a correlation coefficient (R) of 0.582 and weighted average of 23.8%. Similarly, the statistical analysis conducted on geographies consisting of 122,738,905 people shows a moderate positive correlation between the proportion of Estonians and poverty level among children under the age of 16 in the United States with a correlation coefficient (R) of 0.450 and weighted average of 13.9%, a difference of 71.6%.
Child Poverty Under the Age of 16 Correlation Summary
| Measurement | Native/Alaskan | Estonian |
| Minimum | 4.2% | 1.5% |
| Maximum | 73.1% | 100.0% |
| Range | 68.9% | 98.5% |
| Mean | 33.1% | 19.0% |
| Median | 30.2% | 12.1% |
| Interquartile 25% (IQ1) | 23.3% | 8.7% |
| Interquartile 75% (IQ3) | 41.1% | 17.8% |
| Interquartile Range (IQR) | 17.8% | 9.1% |
| Standard Deviation (Sample) | 12.8% | 20.0% |
| Standard Deviation (Population) | 12.8% | 19.8% |
Similar Demographics by Child Poverty Under the Age of 16
Demographics Similar to Natives/Alaskans by Child Poverty Under the Age of 16
In terms of child poverty under the age of 16, the demographic groups most similar to Natives/Alaskans are Dominican (23.8%, a difference of 0.090%), Apache (23.8%, a difference of 0.22%), Pueblo (23.9%, a difference of 0.60%), Immigrants from Dominican Republic (24.0%, a difference of 0.78%), and Black/African American (24.4%, a difference of 2.8%).
| Demographics | Rating | Rank | Child Poverty Under the Age of 16 |
| Paiute | 0.0 /100 | #323 | Tragic 22.4% |
| Central American Indians | 0.0 /100 | #324 | Tragic 22.5% |
| Immigrants | Congo | 0.0 /100 | #325 | Tragic 22.5% |
| Immigrants | Honduras | 0.0 /100 | #326 | Tragic 22.7% |
| Menominee | 0.0 /100 | #327 | Tragic 23.0% |
| Colville | 0.0 /100 | #328 | Tragic 23.0% |
| Dominicans | 0.0 /100 | #329 | Tragic 23.8% |
| Natives/Alaskans | 0.0 /100 | #330 | Tragic 23.8% |
| Apache | 0.0 /100 | #331 | Tragic 23.8% |
| Pueblo | 0.0 /100 | #332 | Tragic 23.9% |
| Immigrants | Dominican Republic | 0.0 /100 | #333 | Tragic 24.0% |
| Blacks/African Americans | 0.0 /100 | #334 | Tragic 24.4% |
| Houma | 0.0 /100 | #335 | Tragic 24.9% |
| Yup'ik | 0.0 /100 | #336 | Tragic 25.1% |
| Sioux | 0.0 /100 | #337 | Tragic 25.2% |
Demographics Similar to Estonians by Child Poverty Under the Age of 16
In terms of child poverty under the age of 16, the demographic groups most similar to Estonians are Korean (13.9%, a difference of 0.060%), Italian (13.9%, a difference of 0.090%), Immigrants from Asia (13.8%, a difference of 0.16%), Immigrants from Czechoslovakia (13.9%, a difference of 0.31%), and Immigrants from Greece (13.9%, a difference of 0.44%).
| Demographics | Rating | Rank | Child Poverty Under the Age of 16 |
| Immigrants | Scotland | 99.4 /100 | #40 | Exceptional 13.7% |
| Croatians | 99.4 /100 | #41 | Exceptional 13.8% |
| Immigrants | Sri Lanka | 99.3 /100 | #42 | Exceptional 13.8% |
| Immigrants | Moldova | 99.3 /100 | #43 | Exceptional 13.8% |
| Greeks | 99.3 /100 | #44 | Exceptional 13.8% |
| Czechs | 99.3 /100 | #45 | Exceptional 13.8% |
| Immigrants | Asia | 99.2 /100 | #46 | Exceptional 13.8% |
| Estonians | 99.2 /100 | #47 | Exceptional 13.9% |
| Koreans | 99.2 /100 | #48 | Exceptional 13.9% |
| Italians | 99.2 /100 | #49 | Exceptional 13.9% |
| Immigrants | Czechoslovakia | 99.1 /100 | #50 | Exceptional 13.9% |
| Immigrants | Greece | 99.1 /100 | #51 | Exceptional 13.9% |
| Poles | 98.9 /100 | #52 | Exceptional 14.0% |
| Immigrants | Israel | 98.8 /100 | #53 | Exceptional 14.1% |
| Tsimshian | 98.8 /100 | #54 | Exceptional 14.1% |